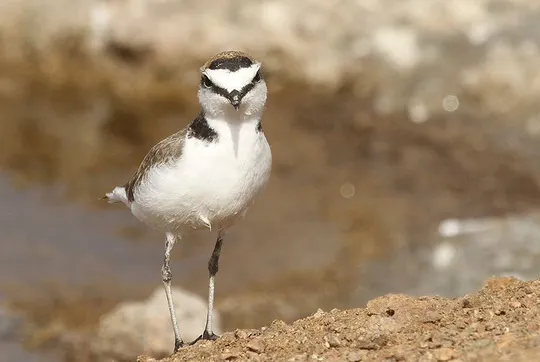
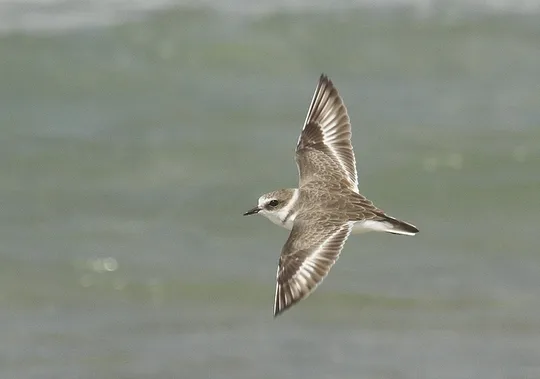
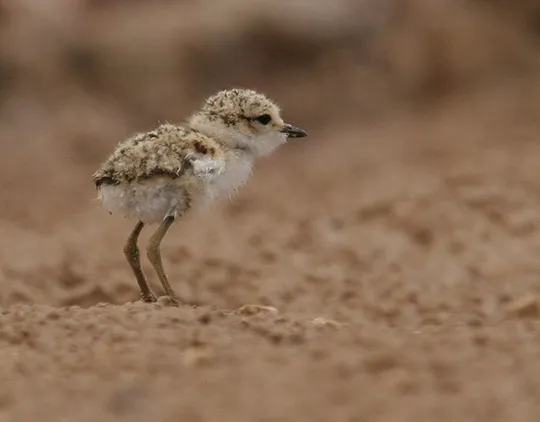
Charadrius alexandrinus
 Endangered
 Contributed:
| Habitats | Salt Ponds, Wetlands with Shallow Banks |
|---|---|
| Presence In Israel | Summer |
| Breeding In Israel | Breeder |
| Migration Types | Short Range / Partial |
| Zoographical Zones | Mediterranean, Sudani |
| Landscape Types | Wetlands, Salt Ponds, Sandy Beach, Salt Marsh |
| Vegetation Densities | Low |
| Nest Locations | Ground |
| Diet Types | Invertebrate |
| Foraging Grounds | Ground |
| Body Sizes | Small (up to 500g) |
| Threat Factors | Wetland Drainage & Pollution, Direct disturbance from human activity, Increased predation from invasive and eruptive species |
The Kentish Plover is an extremely rare resident and summer breeder, and a common passage migrant and winter visitor. The breeding population apparently numbers 30-40 pairs; most of them in the southern Arava saltpans (Itai Shani & Noam Weiss, pers. comm.) and some along the Dead Sea shores (Ron Haran & Avner Rinot, pers. comm.). In 2014, an unsuccessful nesting attempt was observed at the Atlit saltpans (Asaf Mayrose & Yossi Eshbol). Until the mid-1960s, the Kentish Plover was a common breeder along the Mediterranean shores, in the Jordan Valley and in the Northern Valleys. The coastal population disappeared almost completely during the 1970s. In the 1980s there were still about 30 pairs breeding in the northern Coastal Plain and the Bet Tsayda and Hula valleys. The breeding population around the Dead Sea numbered about 100 pairs at that time (Paz 1986, Shirihai 1996). During the decades since, the breeding population in Northern Israel became extinct and the Dead Sea population apparently decreased significantly, although there is a lack of comprehensive data from the region. The population in the southern Arava started breeding during the 1980s and have increased to around 30 pairs.
Sandy, pebbled or mudflat shores along streams, pools, lakes and seas. In the winter moist fields and winter pools are also frequented.
Habitat destruction: including stream regulation and flood prevention at the Jordan River (because of the Deganya Dam) that led to bank stabilization and overgrown with vegetation thickets.
Pollution: pollution of seashores and coastal streams by oils and tar.
Direct disturbance: overload of people and vehicles on seashores, near fishponds, saltpans and along streams.
Eruptive species: increase in the number of predators such as crows, jackals, foxes and mongooses around fishponds, saltpans and reservoirs results in increased predation pressure.
No specific conservation measures have been taken for this species to date.
The Kentish Plover is classified as an endangered species. It has been affected mainly by drainage, pollution and disturbance of freshwater bodies, and direct disturbances, increase in eruptive species and pollution of seashores. The current breeding population in Israel is very small and most of it occupies artificial habitats; a few pairs nest along the Dead Sea shores).
Restricting traffic of people and vehicles around saltpans in the Arava. Comprehensive and updated information from its distribution area around the Dead Sea is needed to assess the status of the species.
- פז, ע. 1986. עופות. מתוך אלון, ע. (עורך), החי והצומח של ארץ ישראל. כרך 6. הוצאת משרד הביטחון, ישראל.
- Shirihai, H., 1996. The Birds of Israel. Academic Press, London.
- Symes, A. 2013. Species generation lengths. Unpublished, BirdLife International.
- Species page at Birdlife International
Contributed:
Current Occupancy Map
| Data Missing | Sporadic | Limited Sites | Low Density | High Density |
|---|---|---|---|---|
| 0 | 0 | 0 | 0 | 0 |
Distribution maps
The maps presented here provide visual information on the distribution of species in Israel from the past and present, and the changes in occupancy and breeding density during the comparison period. For further reading
Relative Abundance 2010-2020
Breeding density values in the current decade as determined from experts' opinion and observations from databases.
| Data Missing | Sporadic | Limited Sites | Low Density | High Density |
|---|---|---|---|---|
| 8 | 12 | 12 | 21 | 19 |
Relative Abundance 1980-1990
Density values based primarily on the book The Birds of Israel (Shirihai 1996).
| Data Missing | Sporadic | Limited Sites | Low Density | High Density |
|---|---|---|---|---|
| 5 | 14 | 14 | 17 | 22 |
Occupancy 1990-2020
The map shows differences in the species breeding distribution between the 1980's breeding map and the current weighted breeding evaluation. Negative value - species previously bred in the grid and is not presently breeding; positive value - species has not previously bred in the grid and is currently breeding.
| Data Missing | No Change | Occupancy Increase | Occupancy Decrease |
|---|---|---|---|
| 6 | 35 | 1 | 9 |
Change in Relative Abundance 1990-2020
The map shows the changes in the relative abundance of a species in each of the distribution grids between the breeding map of the 1980s and the weighted current breeding evaluation. Negative values - decline in abundance; positive values - increase in abundance; zero - no change in abundance.
| 80 to 100 | 50 | 20 to 30 | No Change | 30- to 20- | 50- | 100- to 80- | Data Missing |
|---|---|---|---|---|---|---|---|
| 0 | 4 | 2 | 22 | 12 | 14 | 11 | 16 |
| Rarity | |
|---|---|
| Vulnerability | |
| Attractiveness | |
| Endemism | |
| Red number | |
| Peripherality | |
| IUCN category | |
| Threat Definition according to the red book |


