Introduction
General
The purpose of the Red Book of Breeding Birds in Israel is to assess the status of breeding birds in the country. The book is based on the best information and assessment of tens of expert ornithologists who participated in collecting the data and formulating the opinions regarding species populations. The main function of this book is to identify endangered species and suggest necessary steps to prevent their disappearance from Israel’s landscapes. The book provides an important basis for nature conservation policy, although it should be noted that risk assessment for a species is not the only consideration in prioritizing conservation actions and plans.
The current edition of the book (2017) is an update of the chapter on birds in the Red Book of Vertebrates in Israel (2002), the first red book published in Israel. This update is very significant due to the rapid changes observed in recent years in the distribution of species, their habitats and the threats they face. The International Union for Conservation of Nature (IUCN) recommends updating regional red books at least once every ten years.
The red book of birds is based on the criteria and categories for assessing the threat status of species as formulated by the IUCN and on the guidelines of the organization for adapting the threat levels to the national/regional levels (IUCN 2010).
The first stage of the assessment process for each of the avian species included evaluation according to IUCN Red List Categories and criteria (IUCN 2013). The second stage of the process dealt with adapting the criteria to a regional threat level based on IUCN recommendations, decided upon by the editors of the Israeli red book.
The IUCN threat assessment principles are based in general on the updated status of the abundance and spatial distribution of the species and on the long-term trends evident in these parameters. In order to use quantitative data as much as possible, efforts were made to gather information on the distribution of breeding birds in Israel from the databases of the Israel Nature and Parks Authority and the Society for the Protection of Nature in Israel, including digitation of said information.
Intensive effort was invested in gathering information from different sources, in order to reflect the situation at the time of the evaluation (2017) as accurately as possible. The editors combined the extensive knowledge of Israeli birdwatchers, taking into consideration their expertise regarding different species and different distribution areas. A computerized system was created for this purpose, which allows information to be entered, displayed and easily accessed, which increases the effectiveness of information sharing between the expert birdwatchers and incorporating their feedback. The computerized internet infrastructure was created to support future editions of the book and allow information to be updated on a regular basis.
The Bird Species Included in the Assessment
Israel’s bird life is unusually diverse thanks to its unique location between three continents and a variety of climatic zones. The migration routes over the region are among the most extensive and important in the world, and it is not surprising that the number of bird species seen in Israel during the different seasons is significantly greater than the number of breeding species. About 550 bird species have been seen up to now in Israel, whereas the number of breeding species is about 200, of which some 180 breed regularly and the remaining species are sporadic or accidental breeders. The Red Book focuses on breeding birds in Israel and does not include risk assessments for all the bird populations and species seen in Israel throughout the year. The book includes an assessment of the status of bird species breeding in Israel in recent decades as well as species that bred in Israel during the last one hundred years and have since become extinct. A list of all the species observed in Israel is included, and migrating and wintering birds classified as globally endangered have been highlighted (Birdlife International 2017).
The following criteria were applied to filter and focus the data concerning Israel’s breeding birds:
- Species origin. No assessment was conducted for invasive species (non-native species that started breeding in Israel during the last hundred years due to anthropogenic activity, the pet trade, escapes from captivity, etc.).
- New colonizers. In the case of species discovered nesting in Israel in recent years and whose spread is believed to be part of a natural process, only those nesting continuously for ten or more years were assessed (Except for species for which there is evidence of breeding in Israel in the 20th century, and for which the new findings lead us to believe that they have been breeding continuously in Israel for longer than we know.).
- Breeding status. The book includes all the species breeding annually or nearly annually in Israel (as well as birds that bred regularly and became extinct). That is, species whose breeding in Israel is occasional or accidental were not included. In the case of species represented in Israel by both breeding populations and wintering and migrating populations, efforts were made to distinguish between them and consider only breeding populations.
- Global threat. Species that are threatened globally (from the category of Near Threatened and above) were included in the general listing but not in the regional threat assessment.
Species Names
The taxonomic names in the book is the standard list used by all global conservation organizations (Birdlife International, IUCN), which is updated annually with the latest information collected. The Hebrew names are based, as much as possible, on the list of bird names published by the Academy of the Hebrew Language, including a few necessary currently accepted taxonomic additions and updates, derived from Guide to the Birds of Europe and Israel, Hebrew Edition (Svensson et al. 2003), publications and websites focusing on birdwatching in Israel.
Methods
The IUCN methodology for risk assessment is based on trend changes in the abundance and spatial distribution of species. Thus, it was necessary to create a comprehensive database that compiles updated distribution data that can be compared with earlier data. In order to achieve this, we chose to use the book Birds of Israel (Shirihai 1996) that includes the most systematic and comprehensive mapping of Israel’s birds, as the major benchmark for data on distribution and abundance, and as a template for data input on the current distribution and abundance status. The updated information was obtained from birdwatcher evaluations (contributor names are listed in Appendix B) and from observations collected from databases and various surveys (Israel Nature and Parks Authority and the Society for the Protection of Nature in Israel).
Establishing Species Breeding Status in Grid Cells
The breeding status of each species in The Birds of Israel (Shirihai 1996) was digitized and fed into each grid cell database. In order to enable comparison of current data with data in the book, it was decided to use the same breeding definitions as defined in the book (Table 1). An information system with a web interface was developed for entering information from birders. The system shows the breeding status according to Birds of Israel in each of the map cells and allows each birder to enter his/her breeding assessments, i.e. their assessment of the species breeding status in the selected cell (in the current decade or previous decades). A total of 35 birders contributed some 13,000 different assessments (Table 1).
Division into Assessment Periods and Calculation of Change Rates
The information collected from databases and birders was divided into secondary periods of decades (10-year periods). The time period for calculating population size change rates was taken as the time that elapsed from the end of the reference decade to the beginning of the current decade. Thus, in cases where most of the reference data for a species was taken from Birds of Israel (Shirihai 1996), the analysis was conducted for a period of 20 years (the population status at the beginning of the current decade 2010 compared to 1990, when data collection for the book was completed). In order to calculate IUCN criteria, the change in population size was assumed to be linear throughout the entire period (i.e. a species that decreased by 90% during these two decades was considered to have decreased by 45% during the last decade). Details of the assessment periods are given in Table 1.
|
Assessment period |
1981 - 1990 |
1991 - 2000 |
2001 - 2010 |
2011-2020 |
|
|---|---|---|---|---|---|
|
No. of breeding assessments |
12,521* |
153 |
210 |
12,609 |
|
|
No. of species |
196 |
43 |
47 |
184 |
|
* 12,307 of these from Shirihai, 1996.
Mapping and Spatial Division
In order to adapt the current spatial data to the data from Birds of Israel (Shirihai 1996), the same mapping methods were used, with the map of Israel divided into a grid of 212 identical 11.8 x 13.8 km squares, in which each of the breeding status of the species is presented. The size of the squares was determined according to the internationally accepted division into a grid of half-degrees (that creates squares of approximately 47.5 x 55 km). However, due to Israel’s small size and the need to map species' distribution at a better spatial resolution, the Israeli map was divided into squares of 1/8 of a degree, so that each half-degree square was divided into 16 smaller squares.
Rules for Weighting Breeding Assessments in the Integrated Distribution Map
The editors of the book were authorized to determine which breeding assessments from birders were not valid and would not be used for the integrated distribution map. In cases where breeding assessments for a given grid cell were received from more than one birder, the integrated distribution map received the common positive breeding density value (i.e. the value that indicates that, “there is breeding in the cell”, with the most common breeding density reported by the various expert opinions). In cells with no single common positive value for breeding density, the distribution map received the lowest positive breeding density value of the breeding assessments for the cell.
Cases in which there were acute conflicts among breeding assessments for a given cell (when some of the birders reported “breeding” while others reported “lack of breeding” in the cell) were submitted to the editors for resolution.
Weighting Calculations to Create an Integrated Distribution Map
All the breeding assessments provided by the birders were combined to create a single distribution map for each species for each evaluation period. In cases where a number of different breeding assessments were received for the same species and cell, the data was adjusted according to specific rules for conflicting breeding assessment resolution (see below). Field observations were retrieved from various databases (Israel Nature and Parks Authority and the Society for the Protection of Nature in Israel) and presented on the same grid-map in order to support the decision process. The Area of Occurrence (AOO), the total area of map cells in which the species was observed nesting in the relevant decade, could then be calculated from the distribution map.
Species Generation Length
The generation length of each of the species is required to calculate rates of change in distribution or abundance according to the IUCN criteria. (Generation length is the average age of parents of the current cohort (i.e., newborn individuals in the population). The information on the estimated generation length for most of the avian species in the world was obtained from the BirdLife International Red List for Birds (Andy Symes 2013) and was integrated into the database for calculating population trends.
Calculating Threat Categories Using IUCN Criteria
During the first stage, species threat categories were calculated using IUCN red-list criteria. In this case, the evaluation was conducted as if Israel was the sole range of the species, with no outside influences on its populations, and ignoring the fact that they are usually a very small portion of the global population (these factors were weighted in later, at the regional adaptation stage). Table 3 presents the IUCN criteria, and their application in assessing populations in Israel. Some of the criteria were not applied for one of two reasons:
- The criterion is not suited to Israel’s small size.
- Criteria related to future predictions were not applied due to lack of knowledge and ability to predict potential land use changes in Israel. Applying these criteria would likely worsen the status of the species because of loss of open spaces and the expected development of many natural areas.
|
Criterion |
Basis for the criterion |
CR |
EN |
VU |
Method of application |
|---|---|---|---|---|---|
|
A |
Population size reduction (measured over the longer of 10 years or 3 generations) |
||||
|
A1 |
When the causes of reduction are known/reversible/have ceased |
Reduction of 90% or more |
Reduction of 70% or more |
Reduction of 50% or more |
Not applied |
|
A2 |
When the causes of reduction are unknown/irreversible or may not have ceased |
Reduction of 80% or more |
Reduction of 50% or more |
Reduction of 30% or more |
|
|
A3 |
Population reduction projected to be met in the future |
Reduction of 80% or more |
Reduction of 50% or more |
Reduction of 30% or more |
Not applied |
|
A4 |
An observed or suspected population reduction, where the time period includes both past and future |
Reduction of 80% or more |
Reduction of 50% or more |
Reduction of 30% or more |
Not applied |
|
B |
Restricted geographic area |
||||
|
B1 |
Extent of Occurrence (EOO) less than: |
100 km2 |
5000 km2 |
20,000 km2 |
Not applied |
|
B2 |
Area of Occupancy (AOO) is less than: |
10 km2 |
500 km2 |
2000 km2 |
Occupied cell count in the integrated distribution map (area of each cell is 163 km2) |
|
AND at least 2 of the following 3 conditions: |
|||||
|
B2a |
Severely fragmented population |
The population is spread over a number of locations and affected by a number of threat factors |
Determined based on the editors’ expert opinion |
||
|
B2b |
Continuing decline |
A less extreme decline than criterion A, but which is expected to continue |
Determined based on the editors’ expert opinion |
||
|
B2c |
Extreme fluctuations in Area Of Occupancy or number of individuals |
Fluctuations of at least one order of magnitude between years in the number of individuals or habitat size |
Determined based on the editors’ expert opinion |
||
|
C |
Small population size and decline |
||||
|
Precondition |
Number of mature individuals |
250 |
2,500 |
10,000 |
Determined from national censuses |
|
AND at least one of C1 or C2 |
|||||
|
C1 |
An observed or estimated continuing decline of at least: |
25% in 3 years or 1 generation (whichever is longer) |
20% in 5 years or 2 generations (whichever is longer) |
10% in 10 years or 3 generations (whichever is longer) |
Determined by comparing data from national censuses or the abundance maps |
|
C2 |
An observed or estimated Continuing decline AND at least 1 of the following 3 conditions: |
||||
|
C2a1 |
Number of mature individuals in each subpopulation: |
50 |
250 |
1,000 |
Determined according to specific site censuses |
|
C2a2 |
% of mature individuals in one subpopulation |
90-100% |
95-100% |
100% |
Not applied |
|
C2b |
extreme fluctuations in the number of mature individuals |
|
|
|
Determined based on the editors’ expert opinion |
|
D |
Very small or restricted population |
||||
|
|
Number of mature individuals |
50 |
250 |
D1. <1,000 |
|
|
|
|
|
|
|
|
|
D2 |
VU: Restricted area of Occupancy (AOO) |
|
|
|
Not applied |
|
E |
Quantitative analysis |
||||
|
|
Indicating the probability of extinction in the wild to be: |
50% or more in 10 years or 3 generations |
20% or more in 20 years or 5 generations |
10% or more in 100 years |
|
Calculating the Certainty Index
A certainty index, which reflects the completeness of the existing information regarding the distribution of the species in Israel, was calculated for each species. The index is calculated based on the number of cells in the integrated distribution map 2011-2020, which received breeding status, divided by the number of cells in which the species was recorded as breeding in the period 1981-1990. If the certainty index was below 0.7, the estimated threat level for the species was not calculated. In these cases, the general status of the species was estimated by the editors. Species that are unquestionably common and not declining were categorized as least concern (LC), while species for which there was concern that their populations were declining were categorized as data deficient (DD).
Calculating Abundance and Rates of Change
Reliable estimates for the population size of some of the species are available from surveys or national counts (censuses). In these cases, the data on the number of individuals in the population were used to calculate the rate of population size change throughout the generation length of each species. In the case of species for which there was no reliable population size estimate, a general estimated abundance index was calculated based on weighting the relative abundance of the species (Table 2) according to its integrated distribution map. The relative abundance was calculated as the sum total of all the cells with abundance data, using the formula:
EA (estimated abundance) = an index of estimated national abundance of the species in a given time period. (Calculated for the decade 1981-1990 and for the current decade 2011-2020.)
RAi (relative abundance) = the number of adult breeding birds in each cell in which breeding status, i, was determined (high density, low density, sporadic, limited sites, no breeding).
Ni = the number of cells in which the species had breeding status.
The change rate in the estimated national abundance of a species was based on the difference between national abundance estimates in the current decade (2011-2020) and the decade 1981-1990.
|
Table 2. Breeding status per grid cell according to The Birds of Israel (Shirihai 1996) |
||
|---|---|---|
|
Relative abundance index |
Explanation |
Breeding status |
|
1.0 |
A significant proportion of the cell (half or more) contains habitats suitable for breeding and the species occupies them in relatively high density (according to the species life history characteristics, territory size, etc.) |
High density |
|
0.5 |
A significant proportion of the cell (half or more) contains habitats suitable for breeding and the species occupies them in relatively low density (according to above) |
Low density |
|
0.2 |
The species breeds in the cell occasionally, not every year |
Sporadic |
|
0.2 |
The species uses only a small part of the cell for breeding |
Localized |
|
0 |
There is no evidence of the species breeding in the cell |
No breeding |
Adaptation of Regional Threat Categories
At this stage, after the species’ initial assessment had been made based on IUCN red-list criteria, species were also assessed according to regional criteria that were designed to adapt the threat category to the unique conditions in Israel, the special status of each local population and its degree of connectivity with neighboring populations. This was done with the help of the following regional criteria (with each species potentially receiving a single regional criterion; Table 4):
-
l1. Source/sink population: Distinguishing between species that could benefit from a rescue effect, i.e. the breeding population in Israel is supported by immigration of individuals from neighboring countries into Israel, (in some years when conditions are favorable or as a result of gradual changes), and species for whom Israel is a source for neighboring populations (i.e. birds of prey that breed in Israel and are hunted in neighboring countries):
- Rescue effect (support by immigration): reduction of one threat level.
- Israel is the source population (the local population loses individuals to neighboring countries): increase of one threat level.
-
l2. Species at the edge of their global range, and whose distribution in Israel is negligible relative to their global populations: This criterion is meant to reflect the reduced extinction risk of species whose populations in Israel are marginal, and an insignificant portion of the global population (thus, have only bred in small numbers, i.e. most of the species restricted to Mt. Hermon):
- The Israeli population is an edge population and an insignificant portion (less than 1%) of the species population: reduction of two threat levels.
- The Israeli population is an edge population but a non-negligible portion (greater than 1%) of the species population: reduction of one threat level.
Reduction of threat levels were only applied to species in which no sharp declining trend was observed (20% or more in 10 years). This restriction was intended to provide a solution to the situation in which a dramatic local decline has not yet been observed in other areas.
-
l3. Dependent on active management: This criterion is intended to express the fact that the future of many species depends on conservation efforts and active management, whether by a specific conservation plan or as part of a supportive broader ecological management plan (i.e. maintenance of habitats, nature reserve management, etc.):
- Dependence of the species on supportive management is absolute: regional threat level increases to CR.
- Dependence of the species on supportive management is high: regional threat level increases by one.
- Dependence of the species on supportive management is low: no change in the regional threat level.
-
l4. Adapting the IUCN criterion D to the size of local populations: This adaptation recognizes the fact that threshold values for population size in the IUCN gerneral criterion D are too large relative to Israel’s small size. Thus, if a species is classified as VU/EN only according to criterion D (i.e. the number of adults in the population is below 250/1000 respectively and no significant population decline was recorded): reduction of one threat level.
|
Table 4. Summary of criteria according to which regional adaptations were applied. |
|||
|---|---|---|---|
|
|
Criteria |
Condition |
Application |
|
l1 |
Rescue effect – dependency on immigration or is a source population |
Rescue effect (the Israeli population is reinforced by individuals from neighboring countries) |
reduction of one threat level |
|
|
|
The Israeli population is a source population for neighboring countries |
increase of one threat level |
|
|
|
|
|
|
l2 |
Species at the edge of their global range |
The Israeli population is an insignificant portion of the global population |
reduction of two threat levels |
|
|
|
The Israeli population is a non-negligible portion of the global population |
reduction of one threat level |
|
|
|
|
|
|
l3 |
Dependent on active management |
The species dependence on supportive management is absolute |
regional threat level increases to CR |
|
|
|
The species dependence on supportive management is high |
regional threat level increases by one |
|
|
|
The species dependence on supportive management is low |
(no change in the regional threat level) |
|
|
|
|
|
|
l4 |
Adapting criterion D to the size of Israel |
The species is classified as VU/EN only according to criterion D |
reduction of one threat level |
Methods and Terms
At the beginning of the assessment process, filters were used to create the list of species that were candidates for assessment (native species only, species breeding in Israel continuously). After applying IUCN red-list criteria, an initial threat category was calculated for each species. Application of the regional criteria led to determination of a final regional threat category. A species whose regional threat category changed as a result of the application of regional criteria is marked with a degree symbol (0) above its final regional threat category.
Thus, for example, a species given a threat category CR (C2b) in the assessment process applying IUCN criteria, could decrease by one threat degree after the regional criterion l1 was applied. The species would now be classified as EN0 (C2b l1).
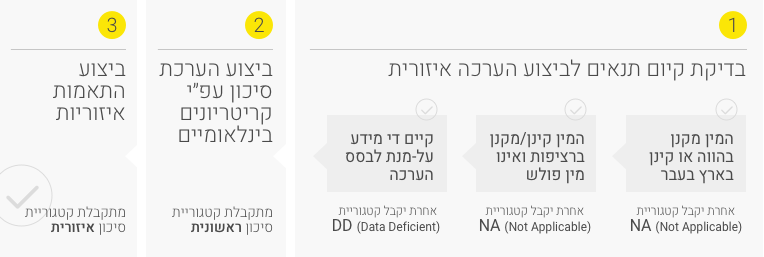
The method used to assess the regional threat to birds in Israel is shown in Figure 1.
Figure 1. Flow chart of the method used for assessing the threat to bird species
Application of additional threat categories
NA (not applicable) – was not assessed: No threat assessment was conducted for the population of a species recorded as breeding in Israel if it conforms to one of the possibilities below:
- Invasive species. The species is a naturalized invasive species in Israel (escaped from captivity or deliberately released) during the last 150 years.
- A new colonizer. A species that became naturalized in Israel during recent years as part of a natural process of expansion. Threat assessment was conducted only for species breeding in Israel for at least 10 consecutive years.
- Sporadic breeder. Threat assessment was conducted only for species breeding in Israel annually on a regular basis or almost every year (as well as those who bred regularly and are now extinct).
NT (Near Threatened): A species is considered Near Threatened when there is evidence of reduction in the population size or its range, but the rate of decrease is lower than the threshold levels determined for the three main threat categories. A species will be classified as near threatened when:
- Criterion A2: the rate of decline or reduction in the area of occupancy approach 30% (the threshold value for VU) and is in the range of 20-30% (over 3 generations/10 years, whichever is longer).
- Criterion B2: the species fulfills the precondition (area of occupancy below 2000 km2), but not two out of three of the additional conditions (fragmented population, sharp fluctuations and continued decline).
- Criterion D: the number of adults in the population is estimated to be 1000-2000 individuals (the threshold value for VU is 1000).
DD (Data Deficient): A species is considered Data Deficient when there is insufficient information to estimate whether the species population is declining or not. A species will be classified as DD when:
- The index of certainty of the species is below 70%. This index is defined as the percent of the breeding range of the species in 1990 (according to “Birds of Israel”) that has any type of current breeding status.
- A species whose current or historical range is uncertain.
RE (Regionally Extinct) – extinct as a breeder in the region: A species is considered RE when there is a high degree of certainty that there are no more breeding individuals of the species in Israel. Regarding birds, this distinction is often problematic, as many species that are extinct as breeders in Israel are still observed as passage migrants, wintering birds or accidentals. Some of the species extinct as breeders for decades have returned to breed (e.g. pygmy cormorant). For this reason, the following definitions have been adopted:
- A species is considered RE if there is a high probability that it bred regularly and continuously in Israel in the past (19th and 20th century), but has not been observed breeding here during the last ten years.
- A species that has not been recorded as breeding in Israel for at least 10 years will be classified as RE, as long as there is no evidence of a population in nature with a potential to reproduce. That is, breeding attempts that did not end in fledging are not considered a renewal of the species population in Israel.
References
IUCN 2012. IUCN Red List Categories and Criteria version 3.1.
IUCN 2013. Guidelines for using IUCN Red List Categories and Criteria Version 10.1.
IUCN 2010. Guidelines for Application of IUCN Red List Criteria at Regional and National Levels. Version 4.0.
Shirihai, H. (1996). The Birds of Israel. Academic Press, London.
Svensson, L. (Author), Mullarney, K.(Illustrator), Zetterström, D.(Illustrator), and P. J. Grant(Contributor). 2003 Hebrew Edition. Bird Guide to the Birds of Europe and Israel. Mapa Mapping and Publishing, Kibbutz Hameuchad, Israel, 408 pp.
Species Threat Categories
The species threat categories as defined by IUCN.
Global Threat – the probability of species extinction as assessed by BirdLife International.
Regional Threat – the estimated probability of the species becoming extinct as a breeder in Israel. This category is applied to the area of Israel, based on the same criteria used for assessing global threat category, combined with the regional adaptations.
|
Abbreviation |
Threat category |
Description |
Quantitative examples to illustrate criteria for determining the threat category |
|---|---|---|---|
|
EX |
Extinct |
There is no reasonable doubt that the last potential breeding individual is dead |
|
|
RE |
Regionally Extinct |
No breeding of the species was observed in our region for at least a decade |
|
|
CR |
Critically endangered |
The species is facing an extremely high risk of extinction in the wild in Israel. The population is particularly small or declining very rapidly |
The population has less than 50 adults or has decreased by 80% or more over the past decade/3 generations (the longer of the two) |
|
EN |
Endangered |
The species is facing a very high risk of extinction in the wild in Israel. The population is small or declining rapidly |
The population has less than 250 adults or has decreased by about 50% or more during the past decade/3 generations |
|
VU |
Vulnerable |
The species is facing a high risk of extinction in the wild in Israel. The population of the species is limited and decreasing |
The population has less than 1,000 adults or has decreased by about 30% or more during the past decade/3 generations |
|
NT |
Near Threatened |
The species does not qualify for any of the threat categories (CR, EN, VU) but is likely to qualify in the near future |
The population has 1,000-1,500 adults or has decreased by about 20% or more during the past decade/3 generations |
|
LC |
Least Concern |
A species that is widespread or not considered to be threatened in the near future |
The population has 1,500 adults or more and has not decreased significantly |
|
DD |
Data Deficient |
A species whose population is reduced or apparently declining but for which there is insufficient data for assessment and quantification |
|
|
NA |
Not Applicable |
A species that did not pass the initial filtering process and was not included in the list of species assessed in this book |
An invasive species, or one that does not breed regularly in Israel, or began breeding in Israel less than a decade ago |


