Circus aeruginosus
 Regionally Extinct
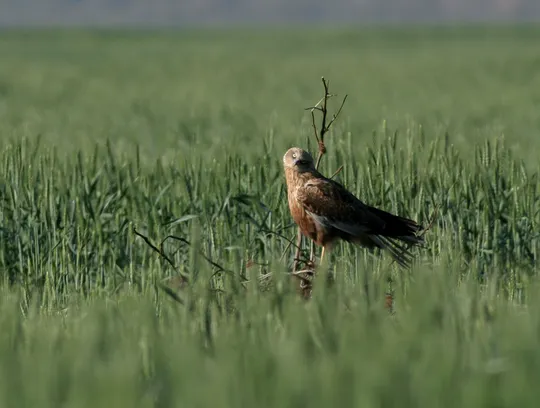
| Habitats | Wetland Thickets, Humid Lowlands |
|---|---|
| Presence In Israel | Resident |
| Breeding In Israel | Bred in the past |
| Migration Types | Resident |
| Zoographical Zones | Mediterranean |
| Landscape Types | Plains & Valleys, Wetlands, Fresh Water, Marsh |
| Vegetation Types | Marsh and Riparian |
| Vegetation Densities | Medium, High |
| Nest Locations | Wetland Thickets |
| Diet Types | Terrestrial Vertebrates, Fish |
| Foraging Grounds | Ground |
| Body Sizes | Medium (500 - 1000g) |
| Threat Factors | Pesticide Poisoning, Wetland Drainage & Pollution |
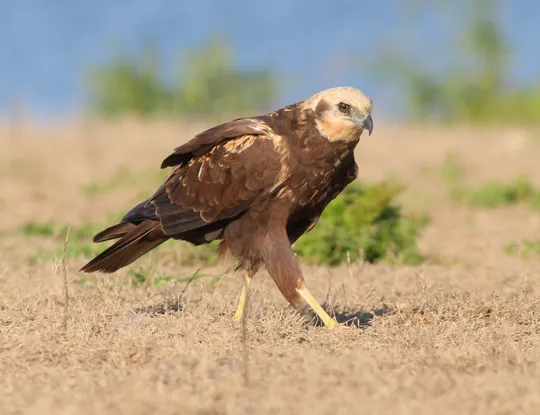
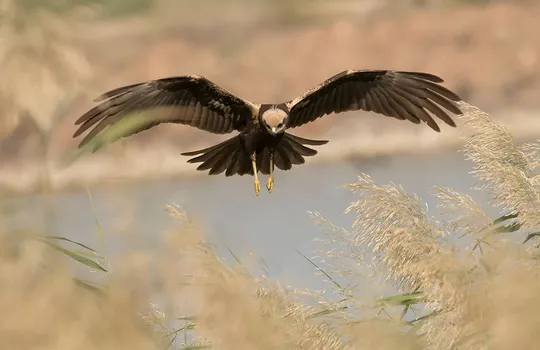
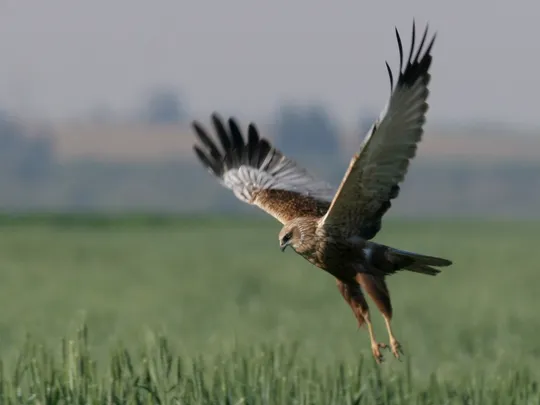
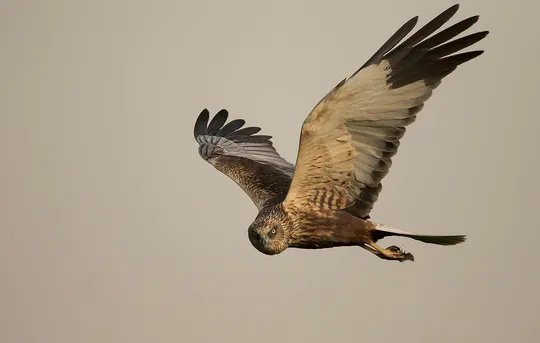
The Western Marsh-harrier is the largest and most common of the four harrier species found in Israel. It displays prominent sexual dimorphism: the male is smaller and paler and its wings are bluish-grey, and the female is dark brown with yellowish head and shoulders. Most of the observations in Israel are of females and juveniles. It hunts by gliding and hovering at low altitudes over meadows and at the edges of water bodies, to prey on small birds and rodents that are its main food source.
About 15 pairs of Western Marsh-harriers nested in the Hula Valley up to 1953, and a single pair bred in the Yavne area in 1918. When the Hula was drained, the breeding population became extinct. A few individuals, mainly juveniles, were seen in the 1980s during the summer months in the Northern Valleys and the Golan Heights, and one pair apparently bred in the Kfar Barukh Reservoir in 1982 (Shirihai 1996).
The Western Marsh-harrier nests in marshes, lakes and streams with extensive bank vegetation thickets. In Israel, it is found in areas of wetlands, fishponds and reservoirs.
The main extinction factors were:
Habitat destruction – the drainage and destruction of marshes and wetlands and the drainage of the Hula marshes in particular.
Pesticides – like most birds of prey, the Western Marsh-harrier was also hurt by secondary poisoning of rodents and other seedeaters, mainly in the 1950s and 1960s.
The Western Marsh-harrier became extinct as a breeder in Israel during the second half of the 20th century, following the drainage of the Hula marshes and other water bodies in the Northern Valleys along with secondary poisoning by agricultural pesticides. The probability of the species returning to breed in Israel naturally and without directed management is estimated at low to middling.
Expanding marsh thickets in the Northern Valleys and in the Hula Valley in particular, would increase the probability that the species will return to breed in Israel naturally.
- הצופה, א. ומירוז, א. 2015. תכנית אב לשימור העופות הדורסים בישראל. מסמך פנימי של רשות הטבע והגנים.
- פז, ע. 1986. עופות. מתוך אלון, ע. (עורך), החי והצומח של ארץ ישראל. כרך 6. הוצאת משרד הביטחון, ישראל.
- Mendelssohn, H. 1972. The impact of pesticides on bird life in Israel. ICBP 11:75-104.
- Mendelssohn, H. 1975. Report on the Status of Some Bird Species in Israel in 1974. I.C.B.P. 12:265-270.
- Shirihai, H., 1996. The Birds of Israel. Academic Press, London.
- Symes, A. 2013. Species generation lengths. Unpublished, BirdLife International.
- Species page at Birdlife International
Distribution maps
The maps presented here provide visual information on the distribution of species in Israel from the past and present, and the changes in occupancy and breeding density during the comparison period. For further reading
Relative Abundance 2010-2020
Breeding density values in the current decade as determined from experts' opinion and observations from databases.
| Data Missing | Sporadic | Limited Sites | Low Density | High Density |
|---|---|---|---|---|
| 8 | 12 | 12 | 21 | 19 |
Relative Abundance 1980-1990
Density values based primarily on the book The Birds of Israel (Shirihai 1996).
| Data Missing | Sporadic | Limited Sites | Low Density | High Density |
|---|---|---|---|---|
| 5 | 14 | 14 | 17 | 22 |
Occupancy 1990-2020
The map shows differences in the species breeding distribution between the 1980's breeding map and the current weighted breeding evaluation. Negative value - species previously bred in the grid and is not presently breeding; positive value - species has not previously bred in the grid and is currently breeding.
| Data Missing | No Change | Occupancy Increase | Occupancy Decrease |
|---|---|---|---|
| 6 | 35 | 1 | 9 |
Change in Relative Abundance 1990-2020
The map shows the changes in the relative abundance of a species in each of the distribution grids between the breeding map of the 1980s and the weighted current breeding evaluation. Negative values - decline in abundance; positive values - increase in abundance; zero - no change in abundance.
| 80 to 100 | 50 | 20 to 30 | No Change | 30- to 20- | 50- | 100- to 80- | Data Missing |
|---|---|---|---|---|---|---|---|
| 0 | 4 | 2 | 22 | 12 | 14 | 11 | 16 |
| Rarity | |
|---|---|
| Vulnerability | |
| Attractiveness | |
| Endemism | |
| Red number | |
| Peripherality | |
| IUCN category | |
| Threat Definition according to the red book |
