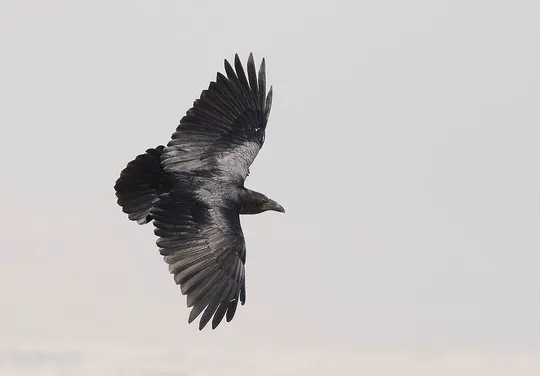
Corvus corax
 Near Threatened
| Habitats | Desert Cliffs, Mediterranean Cliffs |
|---|---|
| Presence In Israel | Resident |
| Breeding In Israel | Breeder |
| Migration Types | Resident |
| Zoographical Zones | Mediterranean, Irano-Turanian, Saharo-Arabian |
| Landscape Types | Mountainous, Cliffs |
| Vegetation Types | Mediterranean Maquis, Mediterranean Garrigue |
| Vegetation Densities | Medium, Low |
| Nest Locations | Cliffs |
| Diet Types | Generalist |
| Foraging Grounds | Ground |
| Body Sizes | Large (over 1000g) |
| Threat Factors | Pesticide Poisoning, Lead Poisoning |
The Common Raven is a relatively rare resident species. It is extinct as a breeder in the Mediterranean region, except for a few pairs in the northern Golan Heights. About 40-80 pairs are estimated to breed in the Judean Desert and Eastern Samaria, and 30 to 50 pairs in the Negev (Mayrose & Hatsofe 2017). In was once a common breeder throughout the Mediterranean region. Until the mid-20th century, a few hundred pairs nested on Mt. Hermon, in the Golan Heights, the Galilee, Mt. Carmel, Samaria and Judea south to Bethlehem. During the 1960s and 1970s, a drastic reduction in the number of individuals was recorded, probably due to poisoning. During the 1980s, the population recovered somewhat, and at the end of the decade 25-30 pairs nested in Israel (Shirihai 1996).
Mountainous or cliff landscapes, mainly in the Mediterranean region, but in other climate conditions as well, except for extreme deserts.
Poisoning – Common Ravens are very susceptible to poisoning as they feed on arthropods and small carrion such as rodents. This is probably the main reason for the dramatic decline in their population, recorded in the second half 20th century.
Direct disturbance – mainly by hikers and rock climbers.
- מירוז, א. והצופה, א. 2014. סיכום סקר קינון עופות דורסים במדבר יהודה. דו"ח רשות הטבע והגנים.
- פז, ע. 1986. עופות. מתוך אלון, ע. (עורך), החי והצומח של ארץ ישראל. כרך 6. הוצאת משרד הביטחון, ישראל.
- פרלמן, י., שוחט, א. ולבינגר, ז. 2009. סקר אטלס ציפורים בערבה סיכום שנת 2009. דו"ח מרכז הצפרות של החברה להגנת הטבע.
- Shirihai, H., 1996. The Birds of Israel. Academic Press, London.
- Symes, A. 2013. Species generation lengths. Unpublished, BirdLife International.
- Species page at Birdlife International
Current Occupancy Map
| Data Missing | Sporadic | Limited Sites | Low Density | High Density |
|---|---|---|---|---|
| 0 | 0 | 0 | 0 | 0 |
Distribution maps
The maps presented here provide visual information on the distribution of species in Israel from the past and present, and the changes in occupancy and breeding density during the comparison period. For further reading
Relative Abundance 2010-2020
Breeding density values in the current decade as determined from experts' opinion and observations from databases.
| Data Missing | Sporadic | Limited Sites | Low Density | High Density |
|---|---|---|---|---|
| 8 | 12 | 12 | 21 | 19 |
Relative Abundance 1980-1990
Density values based primarily on the book The Birds of Israel (Shirihai 1996).
| Data Missing | Sporadic | Limited Sites | Low Density | High Density |
|---|---|---|---|---|
| 5 | 14 | 14 | 17 | 22 |
Occupancy 1990-2020
The map shows differences in the species breeding distribution between the 1980's breeding map and the current weighted breeding evaluation. Negative value - species previously bred in the grid and is not presently breeding; positive value - species has not previously bred in the grid and is currently breeding.
| Data Missing | No Change | Occupancy Increase | Occupancy Decrease |
|---|---|---|---|
| 6 | 35 | 1 | 9 |
Change in Relative Abundance 1990-2020
The map shows the changes in the relative abundance of a species in each of the distribution grids between the breeding map of the 1980s and the weighted current breeding evaluation. Negative values - decline in abundance; positive values - increase in abundance; zero - no change in abundance.
| 80 to 100 | 50 | 20 to 30 | No Change | 30- to 20- | 50- | 100- to 80- | Data Missing |
|---|---|---|---|---|---|---|---|
| 0 | 4 | 2 | 22 | 12 | 14 | 11 | 16 |
| Rarity | |
|---|---|
| Vulnerability | |
| Attractiveness | |
| Endemism | |
| Red number | |
| Peripherality | |
| IUCN category | |
| Threat Definition according to the red book |
 Contributed:


