Emberiza caesia
 Vulnerable
 Contributed:
| Habitats | Rocky Terrain, Mediterranean Batha, Semi-desert Batha, Parks & Woodlands |
|---|---|
| Presence In Israel | Migrant, Summer |
| Breeding In Israel | Breeder |
| Migration Types | Long Range |
| Zoographical Zones | Mediterranean, Irano-Turanian |
| Landscape Types | Mountainous |
| Vegetation Types | Mediterranean Garrigue, Steppe |
| Vegetation Densities | Medium, Low |
| Nest Locations | Ground |
| Diet Types | Invertebrate, Herbivore |
| Foraging Grounds | Ground |
| Body Sizes | Small (up to 500g) |
| Threat Factors | Aforestation, Tree planting, Habitat loss and fragmentation |
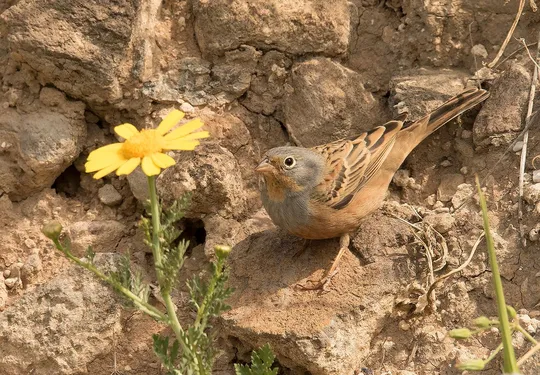
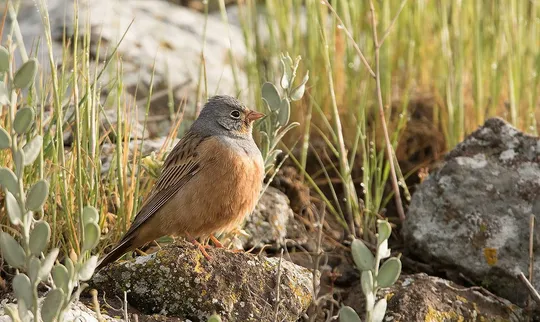
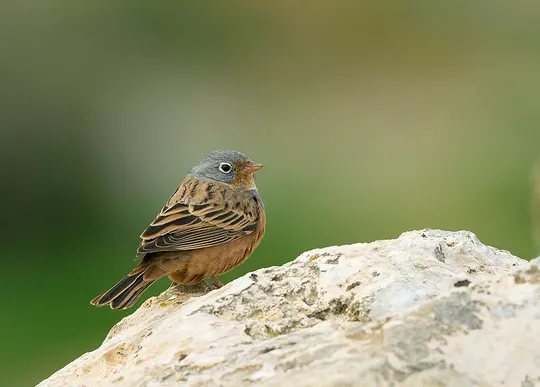
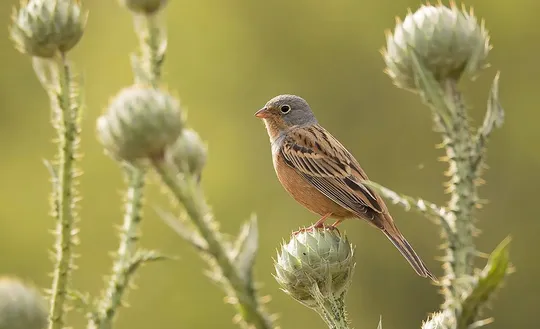
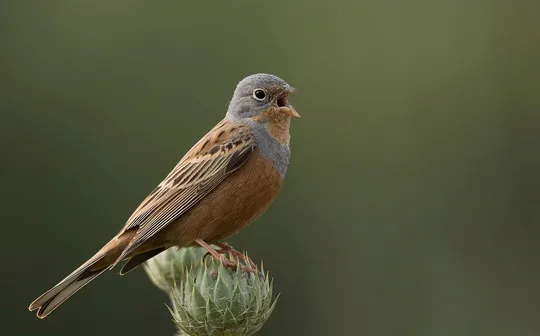
Cretzschmar's Bunting is a medium-sized, slender, delicate bunting. The male has conspicuous plumage: bluish-grey head, dark brown throat and moustache, and a buffish-chestnut belly. The females and juveniles are paler and their plumage is grey-brown. Most individuals have a white eye-ring.
Its flight call is sharp and short, “cheep” and its song melodious, composed of a series of rising and falling whistles. Outside the breeding seasonת, Cretzschmar's Buntings form small flocks. It is a common passage migrant in both migration seasons and a relatively rare summer breeder. It nests in scrubland, shrubland and sparse native woodland on Mt. Hermon, the Golan Heights, the Eastern Galilee, Mt. Gilboa and the Judean and Samarian mountains south to the Northern Negev. Its decline is very pronounced in central and western Israel, and it is relatively common today only in the Golan Heights and the Mt. Hermon slopes.
No specific conservation measures have been taken for this species to date.
- ישראלי, נ. ופרלמן, י. 2013. סיכום סקר עופות מקננים בחרמון. דו"ח מרכז הצפרות של החברה להגנת הטבע.
- פז, ע. 1986. עופות. מתוך אלון, ע. (עורך), החי והצומח של ארץ ישראל. כרך 6. הוצאת משרד הביטחון, ישראל.
- Shirihai, H., 1996. The Birds of Israel. Academic Press, London.
- Symes, A. 2013. Species generation lengths. Unpublished, BirdLife International.
- Species page at Birdlife International
Contributed:
Current Occupancy Map
| Data Missing | Sporadic | Limited Sites | Low Density | High Density |
|---|---|---|---|---|
| 0 | 0 | 0 | 0 | 0 |
Distribution maps
The maps presented here provide visual information on the distribution of species in Israel from the past and present, and the changes in occupancy and breeding density during the comparison period. For further reading
Relative Abundance 2010-2020
Breeding density values in the current decade as determined from experts' opinion and observations from databases.
| Data Missing | Sporadic | Limited Sites | Low Density | High Density |
|---|---|---|---|---|
| 8 | 12 | 12 | 21 | 19 |
Relative Abundance 1980-1990
Density values based primarily on the book The Birds of Israel (Shirihai 1996).
| Data Missing | Sporadic | Limited Sites | Low Density | High Density |
|---|---|---|---|---|
| 5 | 14 | 14 | 17 | 22 |
Occupancy 1990-2020
The map shows differences in the species breeding distribution between the 1980's breeding map and the current weighted breeding evaluation. Negative value - species previously bred in the grid and is not presently breeding; positive value - species has not previously bred in the grid and is currently breeding.
| Data Missing | No Change | Occupancy Increase | Occupancy Decrease |
|---|---|---|---|
| 6 | 35 | 1 | 9 |
Change in Relative Abundance 1990-2020
The map shows the changes in the relative abundance of a species in each of the distribution grids between the breeding map of the 1980s and the weighted current breeding evaluation. Negative values - decline in abundance; positive values - increase in abundance; zero - no change in abundance.
| 80 to 100 | 50 | 20 to 30 | No Change | 30- to 20- | 50- | 100- to 80- | Data Missing |
|---|---|---|---|---|---|---|---|
| 0 | 4 | 2 | 22 | 12 | 14 | 11 | 16 |
| Rarity | |
|---|---|
| Vulnerability | |
| Attractiveness | |
| Endemism | |
| Red number | |
| Peripherality | |
| IUCN category | |
| Threat Definition according to the red book |


