Hippolais languida
 Vulnerable
 Contributed:
| Habitats | Mediterranean Batha, Parks & Woodlands |
|---|---|
| Presence In Israel | Summer |
| Breeding In Israel | Breeder |
| Migration Types | Long Range |
| Zoographical Zones | Mediterranean, Irano-Turanian |
| Landscape Types | Mountainous |
| Vegetation Types | Mediterranean Garrigue, Steppe |
| Vegetation Densities | Medium, Low |
| Nest Locations | Tree, Bushes |
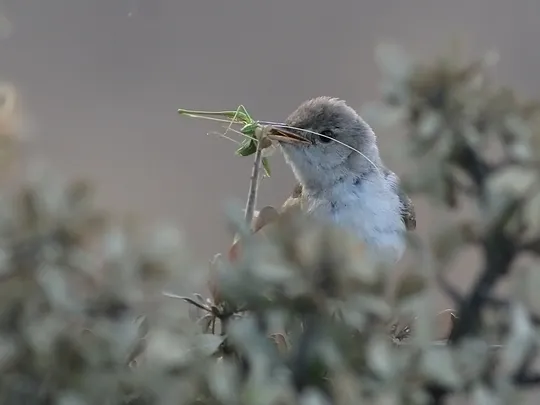
| Diet Types | Invertebrate |
| Foraging Grounds | Trees and Shrubs |
| Body Sizes | Small (up to 500g) |
| Threat Factors | Wildfires, Tree planting, Habitat loss and fragmentation |
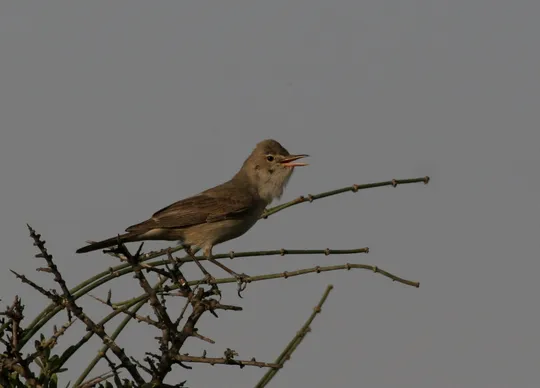
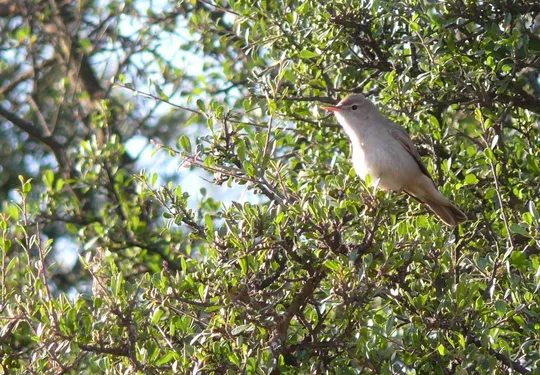
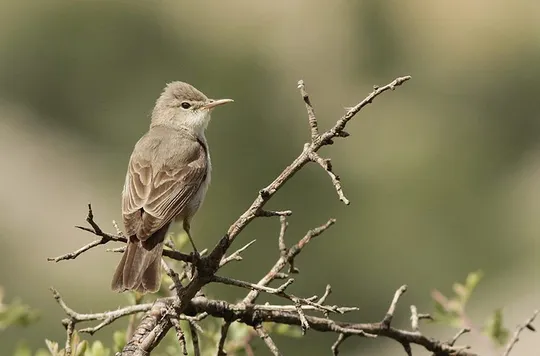
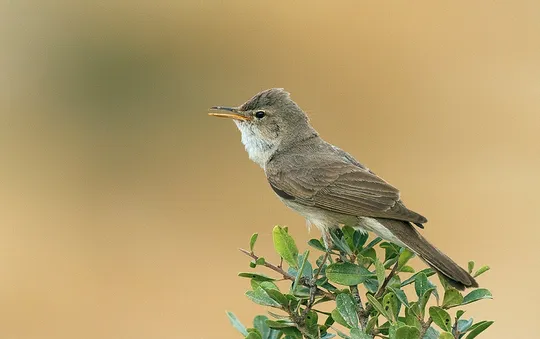
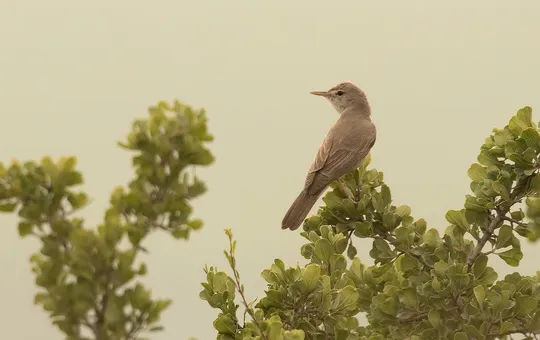
Upcher’s Warbler is a medium sized warbler, larger than the Eastern Olivaceous Warbler and smaller than the Olive-tree Warbler. Its upper parts are dark brown-grey and lower parts are whitish. The tail it is dark, long and wide, bordered in white, which it constantly swings slowly. The male’s song resembles the Nightingale, pleasant and trilling, sung from the top of trees and shrubs.
A rare summer breeder and migrates in small numbers. It nests in shrubland on Mt. Hermon, in the northern Golan Heights and the eastern Lakhish hills. Until the 1980s, it also nested in the Eastern Galilee and Judean and Samarian hills, but in recent years there have been only few observations from these areas.
Habitat destruction due to expansion of settlements and land reclamation for agriculture and planting.
Wildfires in shrubland (Batha and Garrigue) caused by military training exercises.
No specific conservation measures have been taken for this species to date.
Quality Garrigue areas in the northern Golan Heights and the eastern Lakhish region should be protected from wildfires and development.
- ישראלי, נ. ופרלמן, י. 2013. סיכום סקר עופות מקננים בחרמון. דו"ח מרכז הצפרות של החברה להגנת הטבע.
- מירוז, א. 2013. סיכום סקר ציפורים במזרח לכיש, אביב 2013. דו"ח רשות הטבע והגנים.
- מירוז, א. ושוחט, א. 2014. סיכום סקר ציפורים סביב היישוב נטע במזרח לכיש – 2014. דו"ח רשות הטבע והגנים.
- מירוז, א., 2007 . סיכום סקר ציפורים בגבעות גומר. דו"ח עבור רשות הטבע והגנים.
- פז, ע. 1986. עופות. מתוך אלון, ע. (עורך), החי והצומח של ארץ ישראל. כרך 6. הוצאת משרד הביטחון, ישראל.
- Shirihai, H., 1996. The Birds of Israel. Academic Press, London.
- Symes, A. 2013. Species generation lengths. Unpublished, BirdLife International.
- Species page at Birdlife International
Contributed:
Current Occupancy Map
| Data Missing | Sporadic | Limited Sites | Low Density | High Density |
|---|---|---|---|---|
| 0 | 0 | 0 | 0 | 0 |
Distribution maps
The maps presented here provide visual information on the distribution of species in Israel from the past and present, and the changes in occupancy and breeding density during the comparison period. For further reading
Relative Abundance 2010-2020
Breeding density values in the current decade as determined from experts' opinion and observations from databases.
| Data Missing | Sporadic | Limited Sites | Low Density | High Density |
|---|---|---|---|---|
| 8 | 12 | 12 | 21 | 19 |
Relative Abundance 1980-1990
Density values based primarily on the book The Birds of Israel (Shirihai 1996).
| Data Missing | Sporadic | Limited Sites | Low Density | High Density |
|---|---|---|---|---|
| 5 | 14 | 14 | 17 | 22 |
Occupancy 1990-2020
The map shows differences in the species breeding distribution between the 1980's breeding map and the current weighted breeding evaluation. Negative value - species previously bred in the grid and is not presently breeding; positive value - species has not previously bred in the grid and is currently breeding.
| Data Missing | No Change | Occupancy Increase | Occupancy Decrease |
|---|---|---|---|
| 6 | 35 | 1 | 9 |
Change in Relative Abundance 1990-2020
The map shows the changes in the relative abundance of a species in each of the distribution grids between the breeding map of the 1980s and the weighted current breeding evaluation. Negative values - decline in abundance; positive values - increase in abundance; zero - no change in abundance.
| 80 to 100 | 50 | 20 to 30 | No Change | 30- to 20- | 50- | 100- to 80- | Data Missing |
|---|---|---|---|---|---|---|---|
| 0 | 4 | 2 | 22 | 12 | 14 | 11 | 16 |
| Rarity | |
|---|---|
| Vulnerability | |
| Attractiveness | |
| Endemism | |
| Red number | |
| Peripherality | |
| IUCN category | |
| Threat Definition according to the red book |


