Ketupa zeylonensis
 Regionally Extinct

| Habitats | Wetland Thickets, Perennial Stream |
|---|---|
| Presence In Israel | Resident |
| Breeding In Israel | Bred in the past |
| Migration Types | Resident |
| Zoographical Zones | Mediterranean |
| Landscape Types | Wetlands, Riparian, Marsh, Wetland Thickets |
| Vegetation Types | Forest, Mediterranean Maquis, Marsh and Riparian |
| Nest Locations | Cliffs, Tree |
| Diet Types | Fish |
| Foraging Grounds | Water |
| Body Sizes | Large (over 1000g) |
| Threat Factors | Wetland Drainage & Pollution, Hunting and trapping |
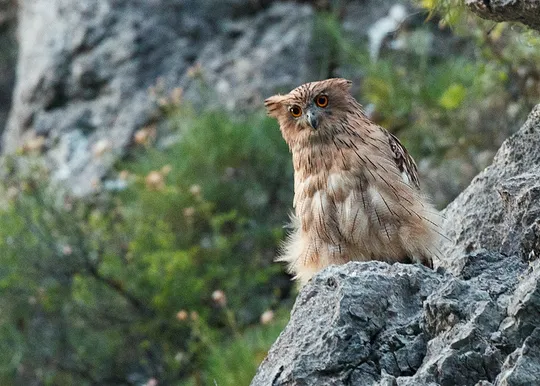
The Brown Fish-owl is a large owl resembling an eagle owl in its broad build and brown plumage. It inhabits wetland habitats and feeds mainly on fish it hunts in shallow swoops towards the water.
Until the early 20th century, the Brown Fish-owl was resident in the Galilee, the Golan Heights, the northern Jordan Valley and the Northern Valleys. The population was estimated at several tens of individuals at minimum. There is no data regarding its breeding biology in Israel, but the population was believed to be resident and breeding. The last observations were from Bet Zera and Hamat Gader in 1974-1975 (Paz 1986, Shirihai 1996).
The Brown Fish-owl has a broad distribution in Southeast Asia, but the western subspecies (K. z. semenowi) has a relictual fragmented distribution and in our region, it is only known from a number of sites in southern Turkey.
In the late 19th century and in the early 20th century the Brown Fish-owl was harmed by collection of numerous specimens for scientific collections. Most of the damage, however, resulted from wetland habitat modification and destruction in northern Israel, such as the drainage of the Hula Marshes, pumping of streams in the Galilee and the Golan Heights and diversion of springs to reservoirs.
The probability of the Brown Fish-owl returning to breed in this area naturally is very low, because the breeding population that occupied the area was at the western edge of its global range. Adjacent populations, e.g. Lebanon and Jordan, have also apparently become extinct (BirdLife 2017). The species is not recommended for reintroduction to nature in Israel at this stage, due to the small number of suitable sites for nesting and the current degraded state of the water sources in the Galilee and Golan streams.
- פז, ע. 1986. עופות. מתוך אלון, ע. (עורך), החי והצומח של ארץ ישראל. כרך 6. הוצאת משרד הביטחון, ישראל.
- Shirihai, H., 1996. The Birds of Israel. Academic Press, London.
- Symes, A. 2013. Species generation lengths. Unpublished, BirdLife International.
- Species page at Birdlife International
Distribution maps
The maps presented here provide visual information on the distribution of species in Israel from the past and present, and the changes in occupancy and breeding density during the comparison period. For further reading
Relative Abundance 2010-2020
Breeding density values in the current decade as determined from experts' opinion and observations from databases.
| Data Missing | Sporadic | Limited Sites | Low Density | High Density |
|---|---|---|---|---|
| 8 | 12 | 12 | 21 | 19 |
Relative Abundance 1980-1990
Density values based primarily on the book The Birds of Israel (Shirihai 1996).
| Data Missing | Sporadic | Limited Sites | Low Density | High Density |
|---|---|---|---|---|
| 5 | 14 | 14 | 17 | 22 |
Occupancy 1990-2020
The map shows differences in the species breeding distribution between the 1980's breeding map and the current weighted breeding evaluation. Negative value - species previously bred in the grid and is not presently breeding; positive value - species has not previously bred in the grid and is currently breeding.
| Data Missing | No Change | Occupancy Increase | Occupancy Decrease |
|---|---|---|---|
| 6 | 35 | 1 | 9 |
Change in Relative Abundance 1990-2020
The map shows the changes in the relative abundance of a species in each of the distribution grids between the breeding map of the 1980s and the weighted current breeding evaluation. Negative values - decline in abundance; positive values - increase in abundance; zero - no change in abundance.
| 80 to 100 | 50 | 20 to 30 | No Change | 30- to 20- | 50- | 100- to 80- | Data Missing |
|---|---|---|---|---|---|---|---|
| 0 | 4 | 2 | 22 | 12 | 14 | 11 | 16 |
| Rarity | |
|---|---|
| Vulnerability | |
| Attractiveness | |
| Endemism | |
| Red number | |
| Peripherality | |
| IUCN category | |
| Threat Definition according to the red book |


