Lanius collurio
 Vulnerable
 Contributed:
| Habitats | Parks & Woodlands, Rural Areas |
|---|---|
| Presence In Israel | Migrant, Summer |
| Breeding In Israel | Breeder |
| Migration Types | Long Range |
| Zoographical Zones | Mediterranean |
| Landscape Types | Mountainous |
| Vegetation Types | Mediterranean Maquis, Mediterranean Garrigue, Steppe |
| Vegetation Densities | Medium, Low |
| Nest Locations | Tree, Bushes |
| Diet Types | Invertebrate |
| Foraging Grounds | Ground, Trees and Shrubs |
| Body Sizes | Small (up to 500g) |
| Threat Factors | Pesticide Poisoning, Habitat destruction in migration and wintering areas, Habitat loss and fragmentation |
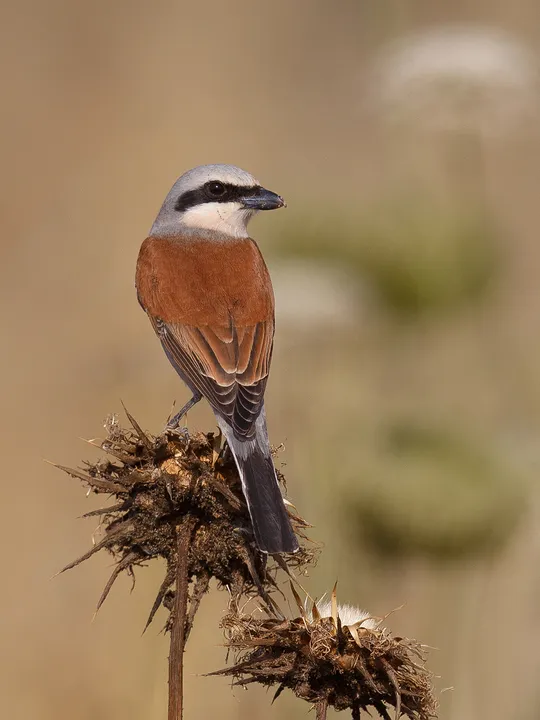
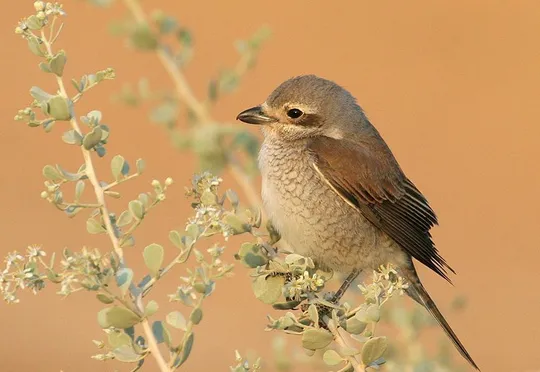
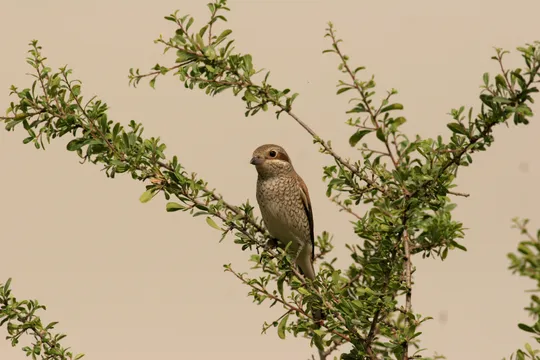
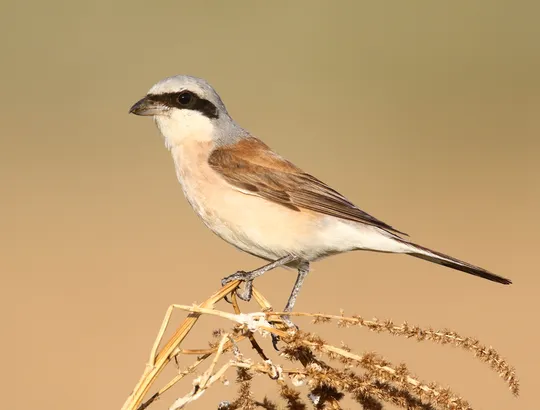
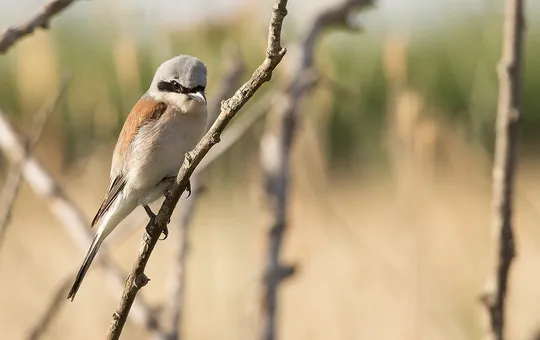
The Red-backed Shrike is a medium-sized shrike with relatively long tail and wings. The male is prominently colored with a black mask around its eyes, a light gray head and neck and a chestnut-colored back. The females and immatures are paler and barred, and lack the black mask.
The Red-backed Shrike is a common passage migrant throughout Israel in spring and fall migration, and a common summer breeder on Mt. Hermon and rare in the northern Golan Heights and the Upper Galilee.
Nests in shrubs, sparse woodland and at the edges of agricultural groves. During migration can be seen on trees and shrubs in all habitats.
The main threat to Red-backed Shrikes in Israel is habitat modification due to development, afforestation and agriculture in the northern Golan Heights, as well as road building, and development of ski runs and other installations on Mt. Hermon. In agricultural areas, the species is probably affected adversely by pesticides, and in wintering and migration areas in Africa by habitat change, desertification and depletion of food sources.
No specific conservation measures have been taken for this species to date.
- ישראלי, נ. ופרלמן, י. 2013. סיכום סקר עופות מקננים בחרמון. דו"ח מרכז הצפרות של החברה להגנת הטבע.
- פז, ע. 1986. עופות. מתוך אלון, ע. (עורך), החי והצומח של ארץ ישראל. כרך 6. הוצאת משרד הביטחון, ישראל.
- Shirihai, H., 1996. The Birds of Israel. Academic Press, London.
- Symes, A. 2013. Species generation lengths. Unpublished, BirdLife International.
- Species page at Birdlife International
Contributed:
Current Occupancy Map
| Data Missing | Sporadic | Limited Sites | Low Density | High Density |
|---|---|---|---|---|
| 0 | 0 | 0 | 0 | 0 |
Distribution maps
The maps presented here provide visual information on the distribution of species in Israel from the past and present, and the changes in occupancy and breeding density during the comparison period. For further reading
Relative Abundance 2010-2020
Breeding density values in the current decade as determined from experts' opinion and observations from databases.
| Data Missing | Sporadic | Limited Sites | Low Density | High Density |
|---|---|---|---|---|
| 8 | 12 | 12 | 21 | 19 |
Relative Abundance 1980-1990
Density values based primarily on the book The Birds of Israel (Shirihai 1996).
| Data Missing | Sporadic | Limited Sites | Low Density | High Density |
|---|---|---|---|---|
| 5 | 14 | 14 | 17 | 22 |
Occupancy 1990-2020
The map shows differences in the species breeding distribution between the 1980's breeding map and the current weighted breeding evaluation. Negative value - species previously bred in the grid and is not presently breeding; positive value - species has not previously bred in the grid and is currently breeding.
| Data Missing | No Change | Occupancy Increase | Occupancy Decrease |
|---|---|---|---|
| 6 | 35 | 1 | 9 |
Change in Relative Abundance 1990-2020
The map shows the changes in the relative abundance of a species in each of the distribution grids between the breeding map of the 1980s and the weighted current breeding evaluation. Negative values - decline in abundance; positive values - increase in abundance; zero - no change in abundance.
| 80 to 100 | 50 | 20 to 30 | No Change | 30- to 20- | 50- | 100- to 80- | Data Missing |
|---|---|---|---|---|---|---|---|
| 0 | 4 | 2 | 22 | 12 | 14 | 11 | 16 |
| Rarity | |
|---|---|
| Vulnerability | |
| Attractiveness | |
| Endemism | |
| Red number | |
| Peripherality | |
| IUCN category | |
| Threat Definition according to the red book |


