Locustella luscinioides
 Regionally Extinct
| Habitats | Wetland Thickets |
|---|---|
| Presence In Israel | Migrant, Summer |
| Breeding In Israel | Bred in the past |
| Migration Types | Long Range |
| Zoographical Zones | Mediterranean |
| Landscape Types | Wetlands, Wetland Thickets |
| Vegetation Types | Marsh and Riparian |
| Vegetation Densities | High |
| Nest Locations | Wetland Thickets |
| Diet Types | Invertebrate |
| Foraging Grounds | Ground, Trees and Shrubs |
| Body Sizes | Small (up to 500g) |
| Threat Factors | Wetland Drainage & Pollution |
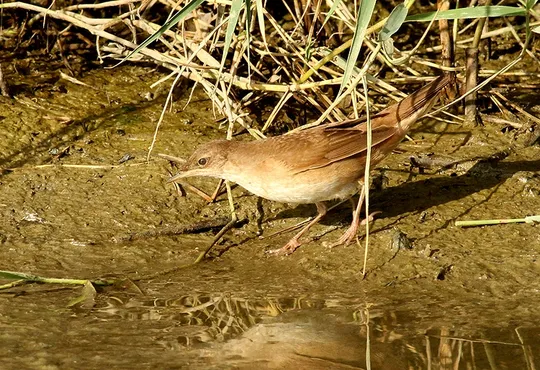
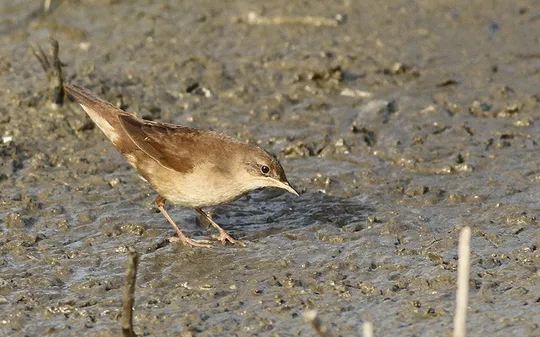
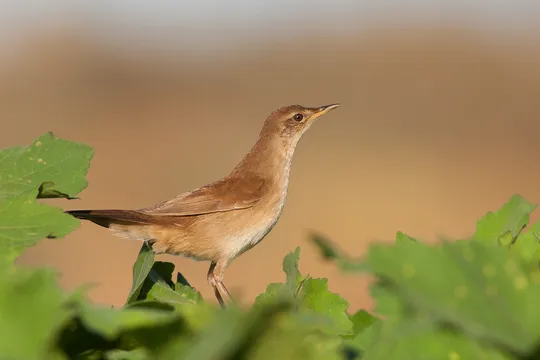
Savi’s Warbler resembles a Reed Warbler with a relatively uniform brown plumage. The back is greyish-brown (occasionally rufous), belly is light brown, chin is white and it has a pale eye-stripe. It has a narrow, pointed head and short wings. Most conspicuous identifying mark is its rounded tail, which has very long under-tail coverts, almost as long as the tail feathers. Savi’s Warbler spends most of its time on the lower part of streambank vegetation, where it moves nimbly on the ground among the reeds, with its rounded tail held high.
Until the 1960s, Savi’s Warbler was a common breeder in wetlands in northern Israel, down to Nahal Hadera in the south. Tens to hundreds of pairs nested on the Carmel coast, the Zevulun and Bet She’an valleys and the Northern Valleys. After most wetlands were drained the number of breeding pairs decreased in all these areas, and by 1980 the population was estimated at about 60 pairs, of which 5-15 nested on the Carmel coast, 30 in the Hula Valley, 15 in northern Sea of Galilee and 1-5 in the Jezreel Valley (Shirihai 1996). During the 1990s, the species disappeared from most of these areas (Mayrose & Alon 2001). Since the early 2000s, there is no concrete evidence of Savi’s Warbler breeding in Israel, although singing males can occasionally be heard in spring in the Hula Valley, and in summer very young fledglings have been seen, which raises the possibility that the species still breeds in the Hula Valley or in nearby Lebanon.
Dense reed thickets and varied riparian vegetation at the edge of marshes and water bodies in Mediterranean or steppe climates.
The main extinction factor seems to be habitat modification – the loss of wetland habitats with varied riparian vegetation and the drainage and pollution of water bodies. The species is also known to be sensitive to global weather changes (Maggini et al. 2014) and along with its extinction in Israel, it has expanded its range in northern Europe.
The breeding Savi’s Warbler population, which once comprised hundreds of pairs, has declined rapidly during the second half of the 20th century, and since the early 2000s, there is no concrete evidence of breeding in Israel. The population that nested in Israel was the southern limit of its global range.
- פז, ע. 1986. עופות. מתוך אלון, ע. (עורך), החי והצומח של ארץ ישראל. כרך 6. הוצאת משרד הביטחון, ישראל.
- Cramp, S and Simmons, R.G. 1992. The Birds of the Western Palearctic, Volume 6. Oxford University Press
- Maggini, R., Lehmann, A., Zbinden, N., Zimmermann, N.E., Bolliger, J., Schröder, B., Foppen, R., Schmid, H., Beniston, M. and Jenni, L. 2014. Assessing species vulnerability to climate and land use change: the case of the Swiss breeding birds. Diversity a
- Shirihai, H., 1996. The Birds of Israel. Academic Press, London.
- Symes, A. 2013. Species generation lengths. Unpublished, BirdLife International.
- Species page at Birdlife International
Current Occupancy Map
| Data Missing | Sporadic | Limited Sites | Low Density | High Density |
|---|---|---|---|---|
| 0 | 0 | 0 | 0 | 0 |
Distribution maps
The maps presented here provide visual information on the distribution of species in Israel from the past and present, and the changes in occupancy and breeding density during the comparison period. For further reading
Relative Abundance 2010-2020
Breeding density values in the current decade as determined from experts' opinion and observations from databases.
| Data Missing | Sporadic | Limited Sites | Low Density | High Density |
|---|---|---|---|---|
| 8 | 12 | 12 | 21 | 19 |
Relative Abundance 1980-1990
Density values based primarily on the book The Birds of Israel (Shirihai 1996).
| Data Missing | Sporadic | Limited Sites | Low Density | High Density |
|---|---|---|---|---|
| 5 | 14 | 14 | 17 | 22 |
Occupancy 1990-2020
The map shows differences in the species breeding distribution between the 1980's breeding map and the current weighted breeding evaluation. Negative value - species previously bred in the grid and is not presently breeding; positive value - species has not previously bred in the grid and is currently breeding.
| Data Missing | No Change | Occupancy Increase | Occupancy Decrease |
|---|---|---|---|
| 6 | 35 | 1 | 9 |
Change in Relative Abundance 1990-2020
The map shows the changes in the relative abundance of a species in each of the distribution grids between the breeding map of the 1980s and the weighted current breeding evaluation. Negative values - decline in abundance; positive values - increase in abundance; zero - no change in abundance.
| 80 to 100 | 50 | 20 to 30 | No Change | 30- to 20- | 50- | 100- to 80- | Data Missing |
|---|---|---|---|---|---|---|---|
| 0 | 4 | 2 | 22 | 12 | 14 | 11 | 16 |
| Rarity | |
|---|---|
| Vulnerability | |
| Attractiveness | |
| Endemism | |
| Red number | |
| Peripherality | |
| IUCN category | |
| Threat Definition according to the red book |
 Contributed:
