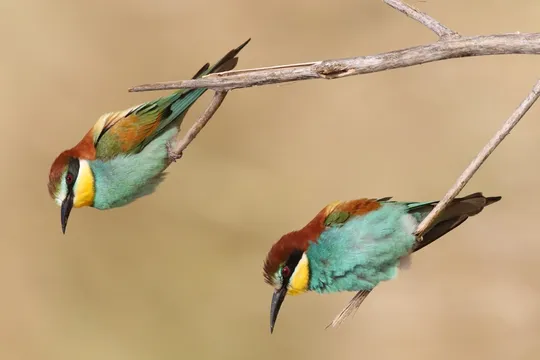
Merops apiaster
 Vulnerable


 Contributed:
| Habitats | Mediterranean Batha, Semi-desert Batha, Parks & Woodlands, Shrubland, Loess Ravines |
|---|---|
| Presence In Israel | Summer, Migrant |
| Breeding In Israel | Breeder |
| Migration Types | Long Range |
| Zoographical Zones | Mediterranean, Irano-Turanian |
| Landscape Types | Plains & Valleys, Wide Wadis, Rural Area |
| Vegetation Types | Mediterranean Garrigue, Steppe |
| Vegetation Densities | Low |
| Nest Locations | Mountainside |
| Diet Types | Invertebrate |
| Foraging Grounds | Aerial |
| Body Sizes | Small (up to 500g) |
| Threat Factors | Pesticide Poisoning, Habitat loss and fragmentation, Direct disturbance from human activity, Tree planting |
The European Bee-eater is a common summer visitor and breeder in small colonies in the Mediterranean and steppe regions, in the Galilee and the Golan Heights, Judea and Samaria, the Jordan Valley and the Northern Negev. In the past, it was a more common summer breeder, but in the 1950s, its population decreased considerably, apparently because of extensive pesticide use. Most of the impact occurred west of the national watershed. During the last two decades the declining trend continues, mainly due to development, plantings and expansion of agricultural areas.
The European Bee-eater nests in the Mediterranean and steppe regions. Habitat includes open landscapes, such as pastures, wide wadis, hills with scattered trees, often near water. It is a colonial nester that digs its nesting burrows in earth walls.
Habitat modification – shrubland (Batha and Garrigue) areas used by bee-eaters for foraging have decreased, and nesting sites, particularly in kurkar (calcareous sandstone) ridges have been affected by construction, excavation and development.
Poisoning – European Bee-eaters frequently nest near agricultural fields and are harmed by pesticides.
Apparently also has been adversely affected in its wintering areas in Africa (Birdlife International).
Destruction of nesting colonies by beekeepers.
Disturbance of nesting colonies by photographers and curious visitors.
No specific conservation measures have been taken for this species to date.
- מירוז, א. 2013. סיכום סקר ציפורים במזרח לכיש, אביב 2013. דו"ח רשות הטבע והגנים.
- מירוז, א. ושוחט, א. 2014. סיכום סקר ציפורים סביב היישוב נטע במזרח לכיש – 2014. דו"ח רשות הטבע והגנים.
- פז, ע. 1986. עופות. מתוך אלון, ע. (עורך), החי והצומח של ארץ ישראל. כרך 6. הוצאת משרד הביטחון, ישראל.
- Shirihai, H., 1996. The Birds of Israel. Academic Press, London.
- Symes, A. 2013. Species generation lengths. Unpublished, BirdLife International.
- Species page at Birdlife International
Contributed:
Current Occupancy Map
| Data Missing | Sporadic | Limited Sites | Low Density | High Density |
|---|---|---|---|---|
| 0 | 0 | 0 | 0 | 0 |
Distribution maps
The maps presented here provide visual information on the distribution of species in Israel from the past and present, and the changes in occupancy and breeding density during the comparison period. For further reading
Relative Abundance 2010-2020
Breeding density values in the current decade as determined from experts' opinion and observations from databases.
| Data Missing | Sporadic | Limited Sites | Low Density | High Density |
|---|---|---|---|---|
| 8 | 12 | 12 | 21 | 19 |
Relative Abundance 1980-1990
Density values based primarily on the book The Birds of Israel (Shirihai 1996).
| Data Missing | Sporadic | Limited Sites | Low Density | High Density |
|---|---|---|---|---|
| 5 | 14 | 14 | 17 | 22 |
Occupancy 1990-2020
The map shows differences in the species breeding distribution between the 1980's breeding map and the current weighted breeding evaluation. Negative value - species previously bred in the grid and is not presently breeding; positive value - species has not previously bred in the grid and is currently breeding.
| Data Missing | No Change | Occupancy Increase | Occupancy Decrease |
|---|---|---|---|
| 6 | 35 | 1 | 9 |
Change in Relative Abundance 1990-2020
The map shows the changes in the relative abundance of a species in each of the distribution grids between the breeding map of the 1980s and the weighted current breeding evaluation. Negative values - decline in abundance; positive values - increase in abundance; zero - no change in abundance.
| 80 to 100 | 50 | 20 to 30 | No Change | 30- to 20- | 50- | 100- to 80- | Data Missing |
|---|---|---|---|---|---|---|---|
| 0 | 4 | 2 | 22 | 12 | 14 | 11 | 16 |
| Rarity | |
|---|---|
| Vulnerability | |
| Attractiveness | |
| Endemism | |
| Red number | |
| Peripherality | |
| IUCN category | |
| Threat Definition according to the red book |


