Neophron percnopterus
 Critically Endangered
 Contributed:
| Habitats | Desert Cliffs, Mediterranean Cliffs, Mountainous Terrain |
|---|---|
| Presence In Israel | Summer |
| Breeding In Israel | Breeder |
| Migration Types | Long Range |
| Zoographical Zones | Mediterranean, Saharo-Arabian, Sudani |
| Landscape Types | Mountainous, Cliffs |
| Vegetation Densities | Medium, Low |
| Nest Locations | Cliffs |
| Diet Types | Carrion |
| Foraging Grounds | Ground |
| Body Sizes | Large (over 1000g) |
| Threat Factors | Electrocution and collision with transmission wires, Human Settlements in Gorges, Hikers and rock climbers, Pesticide Poisoning, Lead Poisoning, Helicopter and aircraft activity in breeding areas, Food Scarcity, Increased mortality in migration and wintering areas, Hunting and trapping |
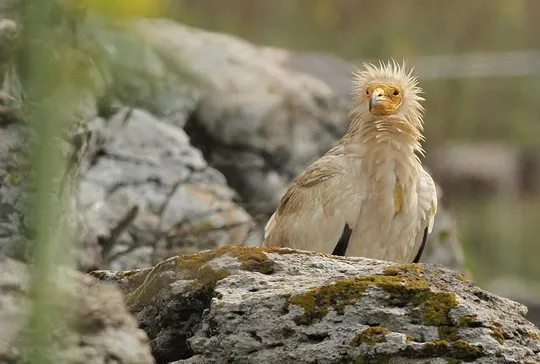
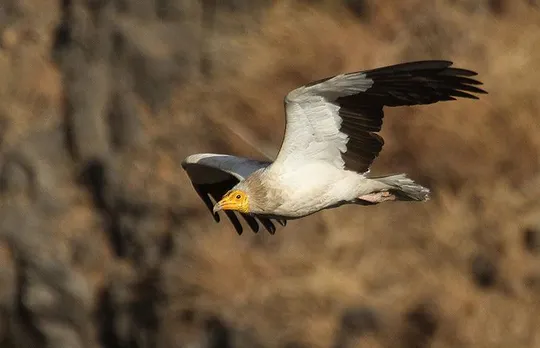
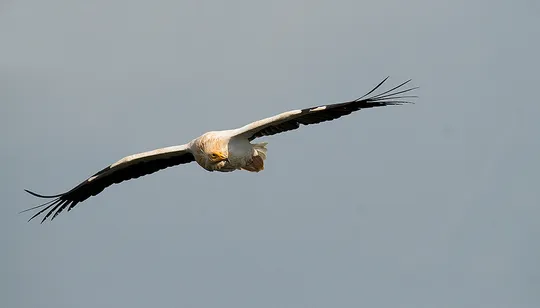
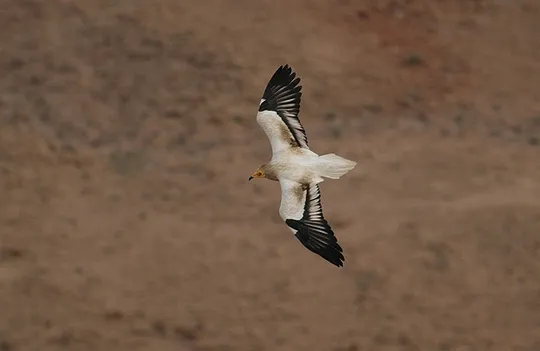
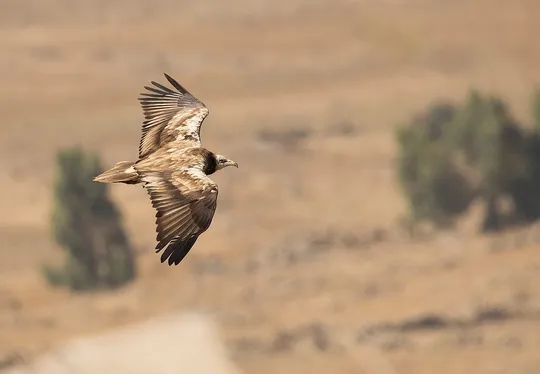
The Egyptian Vulture is a small, relatively delicate vulture, and the smallest vulture in our region. The body of the adult is white, and the contrast between the white body and wing coverts and the black primaries is prominent. Its yellow head is featherless with a long slender beak tipped black. With its delicate beak, the Egyptian Vulture tears off small pieces of meat between the bones of carcasses. It also hunts insects and other small animals and gathers trash. The Egyptian Vulture is one of the only vultures that uses tools, mainly rocks to crack large eggs such as Ostrich.
A rare summer visitor to the Golan Heights, Judean Desert and the Negev. Several hundred individuals pass over during migration. In the past, it was very common and nested in all the cliff areas in Israel, and groups of tens and hundreds of birds could be seen at trash dumps and on carcasses throughout the country. The breeding population in Israel winters in East Africa.
Mountainous cliff landscapes in a variety of climatic regions. Outside the nesting season, it occupies open, flat habitats and sometimes feeds in trash dumps and near human habitations. The nest itself is usually hidden in caves and alcoves in rocky cliffs.
The status change of the Egyptian Vulture has been dramatic, from very common to rare. The decline has been gradual and continuous. In the 1960s, it disappeared as a breeder from Mt. Carmel, in the 1980s from the Western Galilee and Eastern Samaria, and in the 2000s from the Eastern Galilee. In the late 1980s close to 150 breeding pairs were recorded, while today the population is estimated at some 45 to 60 pairs, most of them in the Negev and the Judean Desert.
The Egyptian Vulture has been adversely affected by a number of threats in Israel, among them electrocution, secondary poisoning (including lead poisoning), nesting site disturbance and diminishing food sources. The breeding population in Israel winters in East Africa, where it has also been impacted, apparently mainly by poisoning and electrocution.
In Israel, extensive efforts are invested in preserving and rehabilitating the Egyptian Vulture population. These include:
Establishing a captive breeding nucleus and releasing juvenile birds into nature.
Restricting low flying aircraft in nesting areas.
Removing cattle carcasses from pastures to prevent vulture poisoning from veterinary medications.
Efforts to prevent Egyptian Vulture poisoning by agricultural pesticides.
The Egyptian Vulture is a migratory species that was very common up to a few decades ago, and has become rare and endangered throughout its global range. In Israel considerable efforts are invested to rehabilitate the population, however, because it is a migratory species, conservation is complex and requires international cooperation and action in its breeding grounds as well as in its wintering areas in Africa.
In addition to the conservation measures being implemented, the use of lead shot for hunting should be banned to prevent Egyptian Vulture poisoning from lead accumulation in all levels of the ecosystem. Because the Egyptian Vulture is a migratory species, conservation is complex and requires international cooperation.
- הרלינג, א. 2001. סיכום סקר קינון דורסי יום בשמורת עין גדי. דו"ח רשות הטבע והגנים.
- מירוז, א. והצופה, א. 2014. סיכום סקר קינון עופות דורסים במדבר יהודה. דו"ח רשות הטבע והגנים.
- פז, ע. 1986. עופות. מתוך אלון, ע. (עורך), החי והצומח של ארץ ישראל. כרך 6. הוצאת משרד הביטחון, ישראל.
- פרומקין, ר., מן ש., 1984 .קנון דורסים בחבל המדברי של ישראל 1984-1980. העזניה גליון 11. הוצאת החברה להגנת הטבע.
- פרידמן, ג. 2010. סיכום סקר דורסי יום במחוז צפון. דו"ח עבור רשות הטבע והגנים והחברה להגנת הטבע.
- פרלמן, י., אלתרמן, ש. וגרניט, ב. 2011. סקר עופות דוגרים בנחלים הפנימיים, אביב 2011. דו"ח מרכז הצפרות של החברה להגנת הטבע.
- פרלמן, י., שוחט, א. ולבינגר, ז. 2009. סקר אטלס ציפורים בערבה סיכום שנת 2009. דו"ח מרכז הצפרות של החברה להגנת הטבע.
- Mendelssohn, H. 1972. The impact of pesticides on bird life in Israel. ICBP 11:75-104.
- Mendelssohn, H. 1975. Report on the Status of Some Bird Species in Israel in 1974. I.C.B.P. 12:265-270.
- Shirihai, H., 1996. The Birds of Israel. Academic Press, London.
- Symes, A. 2013. Species generation lengths. Unpublished, BirdLife International.
- Species page at Birdlife International
Contributed:
Current Occupancy Map
| Data Missing | Sporadic | Limited Sites | Low Density | High Density |
|---|---|---|---|---|
| 0 | 0 | 0 | 0 | 0 |
Distribution maps
The maps presented here provide visual information on the distribution of species in Israel from the past and present, and the changes in occupancy and breeding density during the comparison period. For further reading
Relative Abundance 2010-2020
Breeding density values in the current decade as determined from experts' opinion and observations from databases.
| Data Missing | Sporadic | Limited Sites | Low Density | High Density |
|---|---|---|---|---|
| 8 | 12 | 12 | 21 | 19 |
Relative Abundance 1980-1990
Density values based primarily on the book The Birds of Israel (Shirihai 1996).
| Data Missing | Sporadic | Limited Sites | Low Density | High Density |
|---|---|---|---|---|
| 5 | 14 | 14 | 17 | 22 |
Occupancy 1990-2020
The map shows differences in the species breeding distribution between the 1980's breeding map and the current weighted breeding evaluation. Negative value - species previously bred in the grid and is not presently breeding; positive value - species has not previously bred in the grid and is currently breeding.
| Data Missing | No Change | Occupancy Increase | Occupancy Decrease |
|---|---|---|---|
| 6 | 35 | 1 | 9 |
Change in Relative Abundance 1990-2020
The map shows the changes in the relative abundance of a species in each of the distribution grids between the breeding map of the 1980s and the weighted current breeding evaluation. Negative values - decline in abundance; positive values - increase in abundance; zero - no change in abundance.
| 80 to 100 | 50 | 20 to 30 | No Change | 30- to 20- | 50- | 100- to 80- | Data Missing |
|---|---|---|---|---|---|---|---|
| 0 | 4 | 2 | 22 | 12 | 14 | 11 | 16 |
| Rarity | |
|---|---|
| Vulnerability | |
| Attractiveness | |
| Endemism | |
| Red number | |
| Peripherality | |
| IUCN category | |
| Threat Definition according to the red book |


