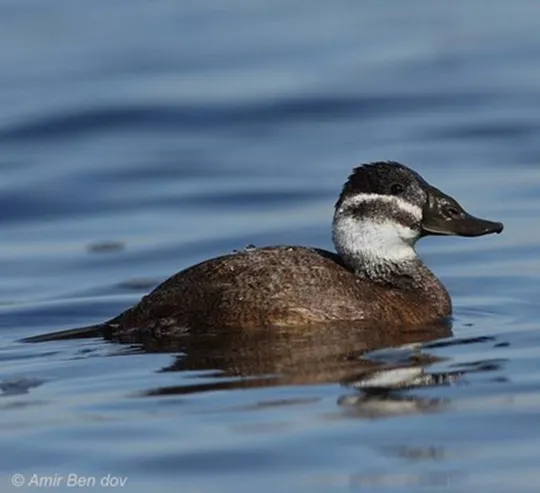
Oxyura leucocephala
 Critically Endangered

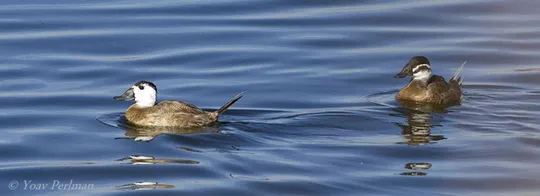
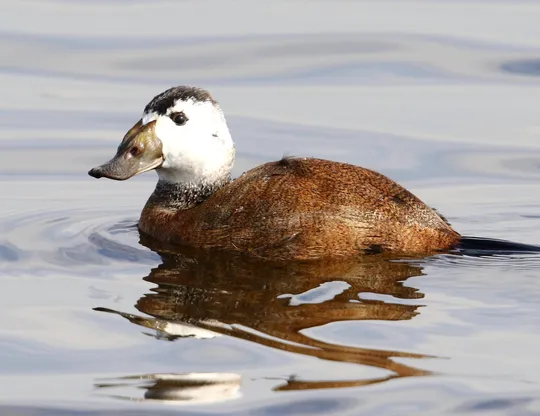
| Habitats | Wetland Thickets |
|---|---|
| Presence In Israel | Summer |
| Breeding In Israel | Irregular Breeder |
| Migration Types | Resident, Nomad |
| Zoographical Zones | Mediterranean |
| Landscape Types | Wetlands, Fresh Water, Marsh |
| Vegetation Types | Marsh and Riparian |
| Vegetation Densities | High |
| Nest Locations | Ground |
| Diet Types | Invertebrate, Herbivore |
| Foraging Grounds | Water |
| Body Sizes | Medium (500 - 1000g) |
| Threat Factors | Wetland Drainage & Pollution, Hunting and trapping |
The White-headed Duck was apparently resident in northern Israel until the early 20th century and bred in lakes and marshes, as well as being a common winter visitor (Tristram 1884, Meinertzhagen 1930). In the second half of the 20th century, there was no evidence of breeding in Israel, but in summer 2017 a family of White-headed ducks with ducklings was seen at a reservoir in the Jezreel Valley (Eldad Amir). White-headed Ducks winter in small numbers (up to 3,000 individuals) in water reservoirs in northern and central Israel. The largest wintering concentration is found in the reservoirs of the Kishon catchment.
The White-headed Duck breeds in marshes and pools with dense bank vegetation that grows into the water. It winters in fishponds and mainly in recycled-water reservoirs in the Mediterranean region.
- פז, ע. 1986. עופות. מתוך אלון, ע. (עורך), החי והצומח של ארץ ישראל. כרך 6. הוצאת משרד הביטחון, ישראל.
- Shirihai, H., 1996. The Birds of Israel. Academic Press, London.
- Symes, A. 2013. Species generation lengths. Unpublished, BirdLife International.
- Species page at Birdlife International
Current Occupancy Map
| Data Missing | Sporadic | Limited Sites | Low Density | High Density |
|---|---|---|---|---|
| 0 | 0 | 0 | 0 | 0 |
Distribution maps
The maps presented here provide visual information on the distribution of species in Israel from the past and present, and the changes in occupancy and breeding density during the comparison period. For further reading
Relative Abundance 2010-2020
Breeding density values in the current decade as determined from experts' opinion and observations from databases.
| Data Missing | Sporadic | Limited Sites | Low Density | High Density |
|---|---|---|---|---|
| 8 | 12 | 12 | 21 | 19 |
Relative Abundance 1980-1990
Density values based primarily on the book The Birds of Israel (Shirihai 1996).
| Data Missing | Sporadic | Limited Sites | Low Density | High Density |
|---|---|---|---|---|
| 5 | 14 | 14 | 17 | 22 |
Occupancy 1990-2020
The map shows differences in the species breeding distribution between the 1980's breeding map and the current weighted breeding evaluation. Negative value - species previously bred in the grid and is not presently breeding; positive value - species has not previously bred in the grid and is currently breeding.
| Data Missing | No Change | Occupancy Increase | Occupancy Decrease |
|---|---|---|---|
| 6 | 35 | 1 | 9 |
Change in Relative Abundance 1990-2020
The map shows the changes in the relative abundance of a species in each of the distribution grids between the breeding map of the 1980s and the weighted current breeding evaluation. Negative values - decline in abundance; positive values - increase in abundance; zero - no change in abundance.
| 80 to 100 | 50 | 20 to 30 | No Change | 30- to 20- | 50- | 100- to 80- | Data Missing |
|---|---|---|---|---|---|---|---|
| 0 | 4 | 2 | 22 | 12 | 14 | 11 | 16 |
| Rarity | |
|---|---|
| Vulnerability | |
| Attractiveness | |
| Endemism | |
| Red number | |
| Peripherality | |
| IUCN category | |
| Threat Definition according to the red book |
