Podiceps cristatus
 Critically Endangered
| Habitats | Wetland Thickets |
|---|---|
| Presence In Israel | Resident, Winter Visitor |
| Breeding In Israel | Breeder |
| Migration Types | Short Range / Partial |
| Zoographical Zones | Mediterranean |
| Landscape Types | Wetlands, Fresh Water, Marsh |
| Vegetation Densities | Medium, High |
| Nest Locations | Wetland Thickets |
| Diet Types | Invertebrate, Fish |
| Foraging Grounds | Water |
| Body Sizes | Large (over 1000g) |
| Threat Factors | Wetland Drainage & Pollution |
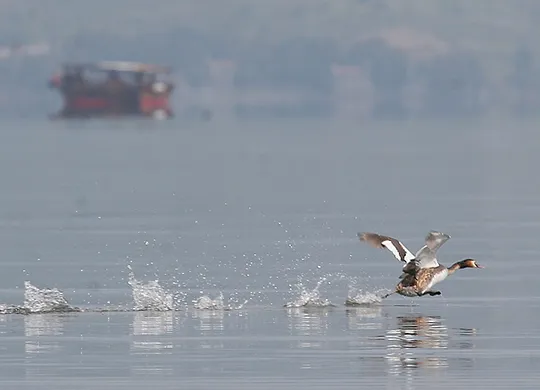
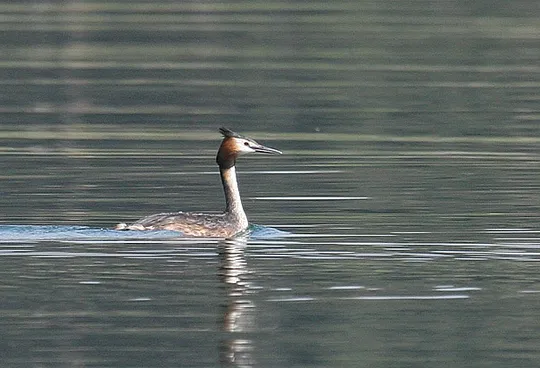
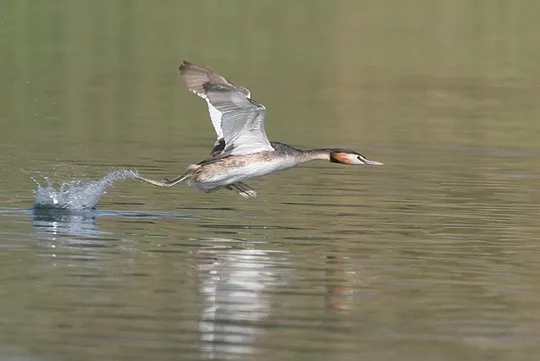
The Great Crested Grebe is the largest grebe in our region, and can be identified by its long white neck and black-capped crested head. Grebes have an impressive courtship display in which the pair perform a synchronized dance on the water surface. The species feeds on fish, crustaceans, water insects and amphibians.
The Great Crested Grebe is a rare summer breeder in water reservoirs at the Jezreel Valley and the Golan Heights. It also is a relatively common winter visitor and passage migrant in northern and central Israel, particularly at Sea of Galilee (up to 2,000 individuals were counted in winter water bird censuses). Tens of pairs once nested in the Hula Valley and a few pairs nested in the Jezreel Valley, in the northern Jordan Valley, the northern Coastal Plain and the Carmel coast. Nesting gradually ceased after the Hula marshes were drained (during the 1950s). In the 1970s and 1980s, a few pairs of grebes were seen over-summering but there was no evidence of breeding. In recent years, small numbers of Great Crested Grebes returned to breed in Israel and families with young were observed in a number of reservoirs in the Jezreel Valley and the southern Golan Heights.
Medium-sized and large water bodies in the Mediterranean region. Over-winter in lakes, reservoirs, large fishponds and on the seacoast. Breeds in freshwater ponds and reservoirs surrounded by dense vegetation.
No specific conservation measures have been taken for this species to date.
The continued existence of the species as a breeder in Israel depends on the existence of water reservoirs surrounded by extensive vegetation thickets. Therefore, vegetation thickets should be allowed to develop around water reservoirs, particularly in northern Israel.
The continued existence of the species as a breeder in Israel depends on the existence of water reservoirs surrounded by extensive vegetation thickets. Therefore, vegetation thickets should be allowed to develop around water reservoirs, particularly in northern Israel.
- פז, ע. 1986. עופות. מתוך אלון, ע. (עורך), החי והצומח של ארץ ישראל. כרך 6. הוצאת משרד הביטחון, ישראל.
- Shirihai, H., 1996. The Birds of Israel. Academic Press, London.
- Symes, A. 2013. Species generation lengths. Unpublished, BirdLife International.
- Species page at Birdlife International
Current Occupancy Map
| Data Missing | Sporadic | Limited Sites | Low Density | High Density |
|---|---|---|---|---|
| 0 | 0 | 0 | 0 | 0 |
Distribution maps
The maps presented here provide visual information on the distribution of species in Israel from the past and present, and the changes in occupancy and breeding density during the comparison period. For further reading
Relative Abundance 2010-2020
Breeding density values in the current decade as determined from experts' opinion and observations from databases.
| Data Missing | Sporadic | Limited Sites | Low Density | High Density |
|---|---|---|---|---|
| 8 | 12 | 12 | 21 | 19 |
Relative Abundance 1980-1990
Density values based primarily on the book The Birds of Israel (Shirihai 1996).
| Data Missing | Sporadic | Limited Sites | Low Density | High Density |
|---|---|---|---|---|
| 5 | 14 | 14 | 17 | 22 |
Occupancy 1990-2020
The map shows differences in the species breeding distribution between the 1980's breeding map and the current weighted breeding evaluation. Negative value - species previously bred in the grid and is not presently breeding; positive value - species has not previously bred in the grid and is currently breeding.
| Data Missing | No Change | Occupancy Increase | Occupancy Decrease |
|---|---|---|---|
| 6 | 35 | 1 | 9 |
Change in Relative Abundance 1990-2020
The map shows the changes in the relative abundance of a species in each of the distribution grids between the breeding map of the 1980s and the weighted current breeding evaluation. Negative values - decline in abundance; positive values - increase in abundance; zero - no change in abundance.
| 80 to 100 | 50 | 20 to 30 | No Change | 30- to 20- | 50- | 100- to 80- | Data Missing |
|---|---|---|---|---|---|---|---|
| 0 | 4 | 2 | 22 | 12 | 14 | 11 | 16 |
| Rarity | |
|---|---|
| Vulnerability | |
| Attractiveness | |
| Endemism | |
| Red number | |
| Peripherality | |
| IUCN category | |
| Threat Definition according to the red book |
 Contributed:
