Ptyonoprogne rupestris
 Vulnerable
 Contributed:
| Presence In Israel | Summer, Winter Visitor, Migrant |
|---|---|
| Breeding In Israel | Breeder, Non-Breeder |
| Migration Types | Short Range / Partial |
| Zoographical Zones | Alpine, Irano-Turanian |
| Landscape Types | Mountainous, Cliffs |
| Vegetation Densities | Low |
| Nest Locations | Cliffs, Buildings |
| Diet Types | Invertebrate |
| Foraging Grounds | Aerial |
| Body Sizes | Small (up to 500g) |
| Threat Factors | Unknown |
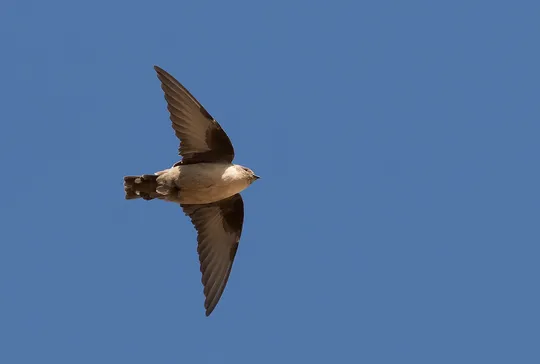
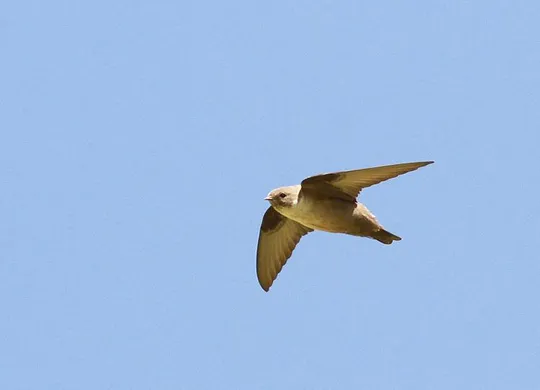
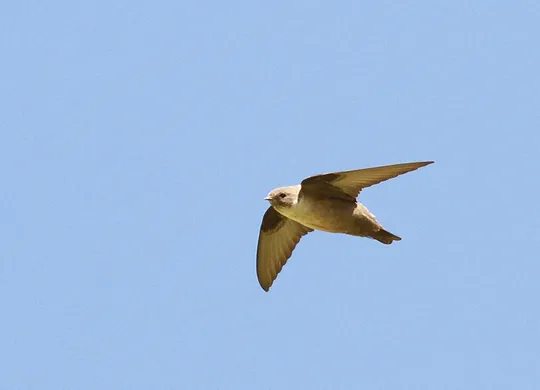
The Eurasian Crag Martin is a medium sized martin with a wide chunky body. It is brown-grey with darker, contrasting underwing coverts.
A few Eurasian Crag Martins nest in Israel, only on the higher areas of Mt. Hermon, from the outskirts of Majdal Shams to the upper ski lift, at an altitude of 1,300-2,200 meters (Ezov 1986, Israeli & Perlman 2013).
The Eurasian Crag Martin nests in mountainous areas in the Alps, the Caucasus and east to the Himalayas, and in our region in the Lebanon and Anti-Lebanon mountains. It builds a nest of mud attached to a cliff, house wall or power pole.
No specific conservation measures have been taken for this species to date.
- ישראלי, נ. ופרלמן, י. 2013. סיכום סקר עופות מקננים בחרמון. דו"ח מרכז הצפרות של החברה להגנת הטבע.
- פז, ע. 1986. עופות. מתוך אלון, ע. (עורך), החי והצומח של ארץ ישראל. כרך 6. הוצאת משרד הביטחון, ישראל.
- Shirihai, H., 1996. The Birds of Israel. Academic Press, London.
- Symes, A. 2013. Species generation lengths. Unpublished, BirdLife International.
- Species page at Birdlife International
Contributed:
Current Occupancy Map
| Data Missing | Sporadic | Limited Sites | Low Density | High Density |
|---|---|---|---|---|
| 0 | 0 | 0 | 0 | 0 |
Distribution maps
The maps presented here provide visual information on the distribution of species in Israel from the past and present, and the changes in occupancy and breeding density during the comparison period. For further reading
Relative Abundance 2010-2020
Breeding density values in the current decade as determined from experts' opinion and observations from databases.
| Data Missing | Sporadic | Limited Sites | Low Density | High Density |
|---|---|---|---|---|
| 8 | 12 | 12 | 21 | 19 |
Relative Abundance 1980-1990
Density values based primarily on the book The Birds of Israel (Shirihai 1996).
| Data Missing | Sporadic | Limited Sites | Low Density | High Density |
|---|---|---|---|---|
| 5 | 14 | 14 | 17 | 22 |
Occupancy 1990-2020
The map shows differences in the species breeding distribution between the 1980's breeding map and the current weighted breeding evaluation. Negative value - species previously bred in the grid and is not presently breeding; positive value - species has not previously bred in the grid and is currently breeding.
| Data Missing | No Change | Occupancy Increase | Occupancy Decrease |
|---|---|---|---|
| 6 | 35 | 1 | 9 |
Change in Relative Abundance 1990-2020
The map shows the changes in the relative abundance of a species in each of the distribution grids between the breeding map of the 1980s and the weighted current breeding evaluation. Negative values - decline in abundance; positive values - increase in abundance; zero - no change in abundance.
| 80 to 100 | 50 | 20 to 30 | No Change | 30- to 20- | 50- | 100- to 80- | Data Missing |
|---|---|---|---|---|---|---|---|
| 0 | 4 | 2 | 22 | 12 | 14 | 11 | 16 |
| Rarity | |
|---|---|
| Vulnerability | |
| Attractiveness | |
| Endemism | |
| Red number | |
| Peripherality | |
| IUCN category | |
| Threat Definition according to the red book |


