Serinus syriacus
 Vulnerable
 Contributed:
| Habitats | Mountainous Forest |
|---|---|
| Presence In Israel | Summer, Winter Visitor |
| Breeding In Israel | Breeder |
| Migration Types | Short Range / Partial |
| Zoographical Zones | Alpine |
| Landscape Types | Mountainous |
| Vegetation Types | Mediterranean Maquis, Mediterranean Garrigue |
| Vegetation Densities | Medium, High |
| Nest Locations | Tree, Bushes |
| Diet Types | Herbivore |
| Foraging Grounds | Ground, Trees and Shrubs |
| Body Sizes | Small (up to 500g) |
| Threat Factors | Hunting and trapping, Habitat loss and fragmentation |
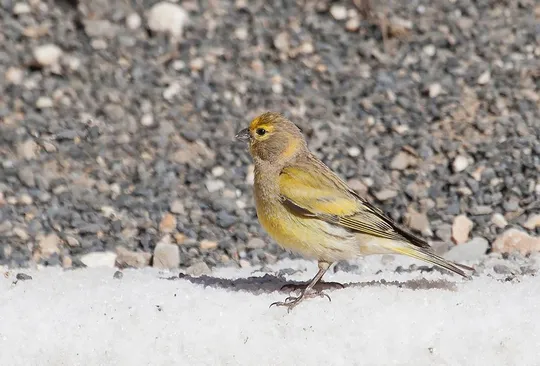
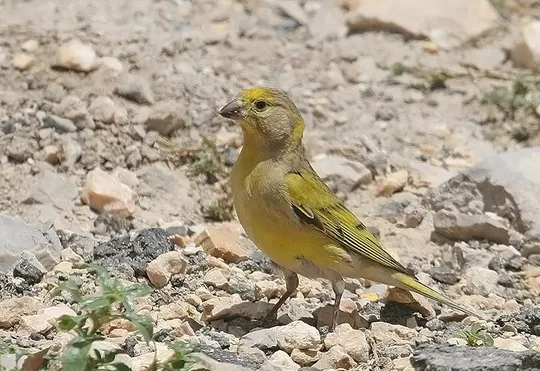
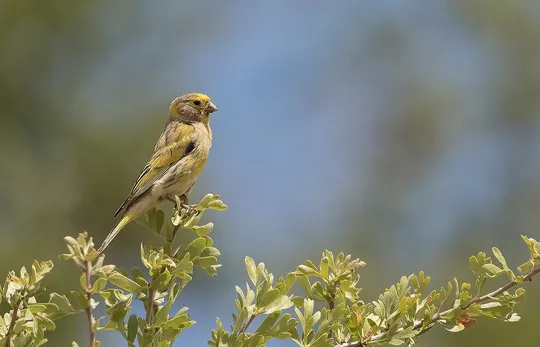
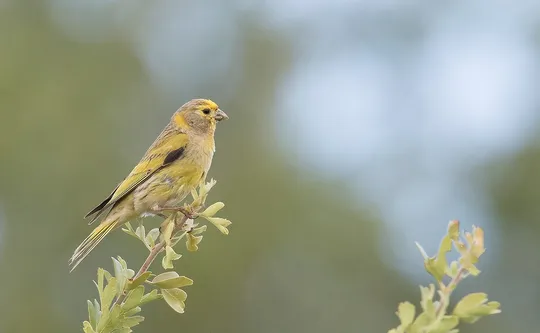
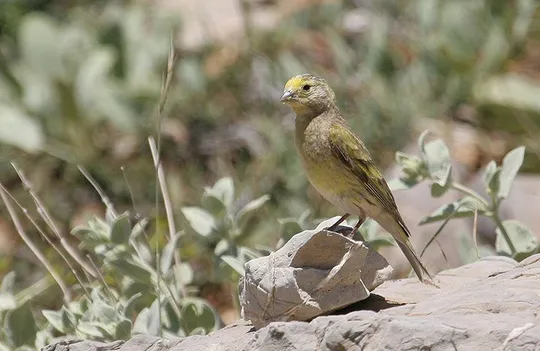
The Syrian Serin is a small finch, endemic to our region. The male has a yellow forehead, belly and back and bluish-grey cheeks and nape. The female is a bit paler and more streaked.
About 100-150 pairs of Syrian Serin breed on Mt. Hermon, at altitudes between 1,200 and 1,800 meters (Israeli & Perlman 2013). In the 1980s, the population was estimated at about 180 pairs (Ezov 1986). In winter, small numbers can be seen in Judea, Samaria, in the Negev, the Arava and the Eilat Mountains.
The Syrian Serin inhabits rocky mountain slopes with sparse deciduous woodland.
The Syrian Serin is endemic to our region. It nests in the in the Lebanon and Anti-Lebanon mountains, Mt. Hermon and the Edom Mountains. The populations migrate south in summer, including to the Negev and the Sinai Peninsula.
The Syrian Serin is threatened by development work at the upper Mt. Hermon, including roadbuilding, ski run development and other installations. It is also trapped for the pet trade. In the Moab and Edom mountains in Jordan, it has been affected by overgrazing and a series of drought years (BirdLife 2017).
No specific conservation measures have been taken for this species to date.
Development work on Mt. Hermon should be reduced and supervised to minimize harm to natural habitats.
Development work on Mt. Hermon should be reduced and supervised to minimize harm to natural habitats.
- ישראלי, נ. ופרלמן, י. 2013. סיכום סקר עופות מקננים בחרמון. דו"ח מרכז הצפרות של החברה להגנת הטבע.
- פז, ע. 1986. עופות. מתוך אלון, ע. (עורך), החי והצומח של ארץ ישראל. כרך 6. הוצאת משרד הביטחון, ישראל.
- שוחט, א., פרלמן, י., שני, א., עובדיה, ע., ישראלי, נ., פרלמן, ג. ואלון, ד. 2009. טיבוע ציפורים ארוך טווח בחרמון: תמורות בהרכב החברה ובדינאמיקה של אוכלוסיות.
- Shirihai, H., 1996. The Birds of Israel. Academic Press, London.
- Symes, A. 2013. Species generation lengths. Unpublished, BirdLife International.
- Species page at Birdlife International
Contributed:
Current Occupancy Map
| Data Missing | Sporadic | Limited Sites | Low Density | High Density |
|---|---|---|---|---|
| 0 | 0 | 0 | 0 | 0 |
Distribution maps
The maps presented here provide visual information on the distribution of species in Israel from the past and present, and the changes in occupancy and breeding density during the comparison period. For further reading
Relative Abundance 2010-2020
Breeding density values in the current decade as determined from experts' opinion and observations from databases.
| Data Missing | Sporadic | Limited Sites | Low Density | High Density |
|---|---|---|---|---|
| 8 | 12 | 12 | 21 | 19 |
Relative Abundance 1980-1990
Density values based primarily on the book The Birds of Israel (Shirihai 1996).
| Data Missing | Sporadic | Limited Sites | Low Density | High Density |
|---|---|---|---|---|
| 5 | 14 | 14 | 17 | 22 |
Occupancy 1990-2020
The map shows differences in the species breeding distribution between the 1980's breeding map and the current weighted breeding evaluation. Negative value - species previously bred in the grid and is not presently breeding; positive value - species has not previously bred in the grid and is currently breeding.
| Data Missing | No Change | Occupancy Increase | Occupancy Decrease |
|---|---|---|---|
| 6 | 35 | 1 | 9 |
Change in Relative Abundance 1990-2020
The map shows the changes in the relative abundance of a species in each of the distribution grids between the breeding map of the 1980s and the weighted current breeding evaluation. Negative values - decline in abundance; positive values - increase in abundance; zero - no change in abundance.
| 80 to 100 | 50 | 20 to 30 | No Change | 30- to 20- | 50- | 100- to 80- | Data Missing |
|---|---|---|---|---|---|---|---|
| 0 | 4 | 2 | 22 | 12 | 14 | 11 | 16 |
| Rarity | |
|---|---|
| Vulnerability | |
| Attractiveness | |
| Endemism | |
| Red number | |
| Peripherality | |
| IUCN category | |
| Threat Definition according to the red book |


