Sterna hirundo
 Vulnerable
| Habitats | Coastal Islats, Salt Ponds, Wetlands with Shallow Banks |
|---|---|
| Presence In Israel | Summer, Migrant |
| Breeding In Israel | Breeder |
| Migration Types | Long Range |
| Zoographical Zones | Mediterranean |
| Landscape Types | Wetlands, Fresh Water, Salt Ponds, Coastal Islats, Mud Plain |
| Vegetation Densities | Low |
| Nest Locations | Ground |
| Diet Types | Fish |
| Foraging Grounds | Water |
| Body Sizes | Small (up to 500g) |
| Threat Factors | Wetland Drainage & Pollution |
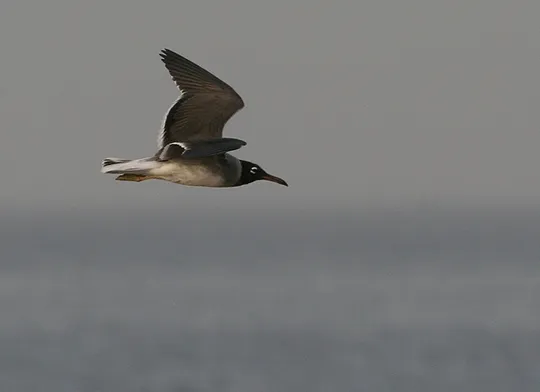
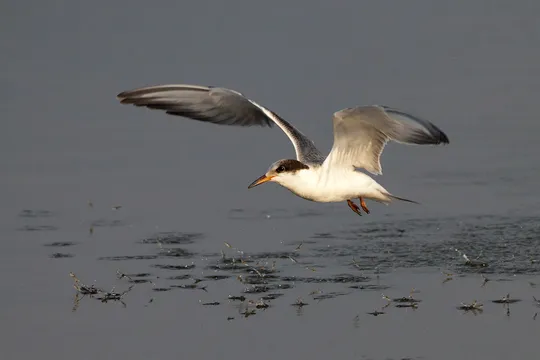
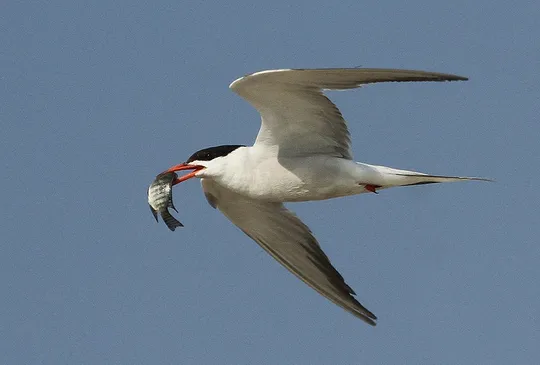
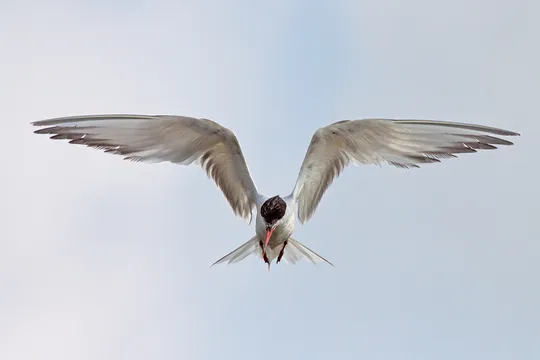
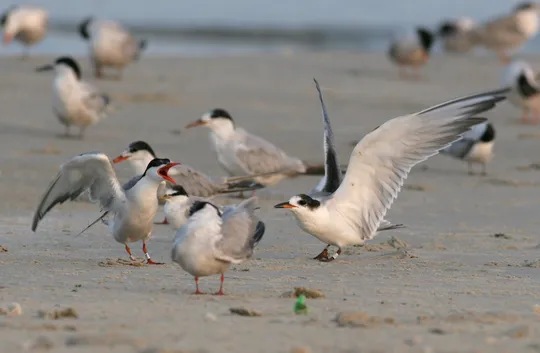
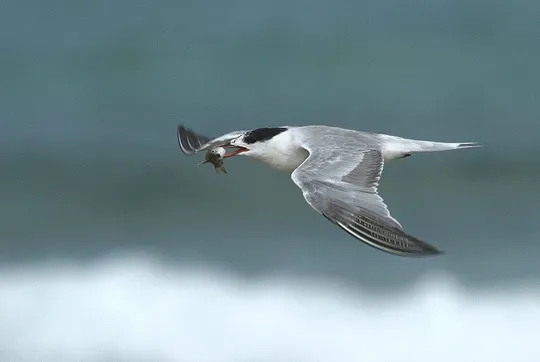
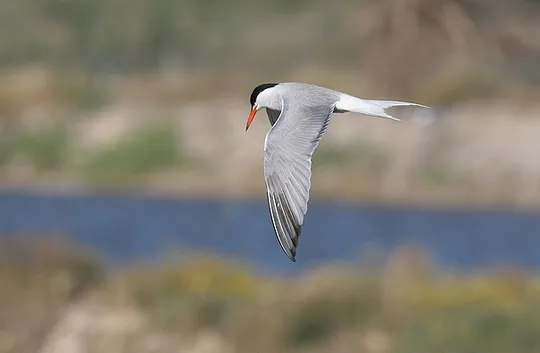
The Common Tern is the typical and most common representative of the terns in Israel, and the only one that breeds here in significant numbers. A relatively small slender tern, with a pale grey back and a white belly. In summer plumage, legs are red and it has a red, black-tipped bill. It has long, narrow pointed wings, and a long, forked tail. When foraging it flies in circles or hovers in place and then dives into the water.
A common passage migrant in both migration seasons. It is a summer breeder in a number of colonies, the largest of which are on the Carmel Coast and the others on the islands opposite Rosh HaNikra and in the Hula Valley. The breeding population comprises about 1,000 pairs.
The Common Tern is a colonial breeder on seashores or in inland lakes and ponds. The colonies are located on rocky islands, mud and sand bars or on undisturbed beaches. The nest is a shallow depression in the ground, or slightly raised on a pile of gravel or pebbles (particularly when nesting in shallow water). Lone pairs or several pairs occasionally use rafts, buoys, pipes and the like to nest, in inland water bodies such as fishponds or reservoirs.
Direct human disturbance, e.g. people in off-road vehicles and on foot (on shores and reservoirs), boating and fishing activity around islands in the sea.
In artificial water bodies, they are affected by rapid water level fluctuation that inundate nests or expose them to predators.
Increased predation by invasive and eruptive species, e.g. jackals, mongooses, foxes and crows.
During recent years, all Common Tern breeding sites are regularly monitored. The largest breeding colony is in the Atlit saltpans, where the nesting island was expanded and fenced to prevent nest inundation and predator invasion of the colony. At a number of other sites, e.g. the Hula Nature Reserve, artificial nesting islands have been built.
- הצופה, א. ומירוז, א. 2009. קינון שחפיות בישראל - תמונת מצב והמלצות לממשק. מסמך פנימי של רשות הטבע והגנים והחברה להגנת הטבע.
- פז, ע. 1986. עופות. מתוך אלון, ע. (עורך), החי והצומח של ארץ ישראל. כרך 6. הוצאת משרד הביטחון, ישראל.
- ריבק, א., כיאט, י., גולדשטיין, ע., והצופה, א. 2017. קינון שחפיות בחוף הכרמל - סיכום עונת 2017.
- Shirihai, H., 1996. The Birds of Israel. Academic Press, London.
- Symes, A. 2013. Species generation lengths. Unpublished, BirdLife International.
- Species page at Birdlife International
Current Occupancy Map
| Data Missing | Sporadic | Limited Sites | Low Density | High Density |
|---|---|---|---|---|
| 0 | 0 | 0 | 0 | 0 |
Distribution maps
The maps presented here provide visual information on the distribution of species in Israel from the past and present, and the changes in occupancy and breeding density during the comparison period. For further reading
Relative Abundance 2010-2020
Breeding density values in the current decade as determined from experts' opinion and observations from databases.
| Data Missing | Sporadic | Limited Sites | Low Density | High Density |
|---|---|---|---|---|
| 8 | 12 | 12 | 21 | 19 |
Relative Abundance 1980-1990
Density values based primarily on the book The Birds of Israel (Shirihai 1996).
| Data Missing | Sporadic | Limited Sites | Low Density | High Density |
|---|---|---|---|---|
| 5 | 14 | 14 | 17 | 22 |
Occupancy 1990-2020
The map shows differences in the species breeding distribution between the 1980's breeding map and the current weighted breeding evaluation. Negative value - species previously bred in the grid and is not presently breeding; positive value - species has not previously bred in the grid and is currently breeding.
| Data Missing | No Change | Occupancy Increase | Occupancy Decrease |
|---|---|---|---|
| 6 | 35 | 1 | 9 |
Change in Relative Abundance 1990-2020
The map shows the changes in the relative abundance of a species in each of the distribution grids between the breeding map of the 1980s and the weighted current breeding evaluation. Negative values - decline in abundance; positive values - increase in abundance; zero - no change in abundance.
| 80 to 100 | 50 | 20 to 30 | No Change | 30- to 20- | 50- | 100- to 80- | Data Missing |
|---|---|---|---|---|---|---|---|
| 0 | 4 | 2 | 22 | 12 | 14 | 11 | 16 |
| Rarity | |
|---|---|
| Vulnerability | |
| Attractiveness | |
| Endemism | |
| Red number | |
| Peripherality | |
| IUCN category | |
| Threat Definition according to the red book |
 Contributed: