Struthio camelus syriacus
 Regionally Extinct
| Habitats | Shrubland, Desert Plains, Acaicia Savanna |
|---|---|
| Presence In Israel | Resident |
| Breeding In Israel | Bred in the past |
| Migration Types | Nomad |
| Zoographical Zones | Irano-Turanian, Saharo-Arabian, Sudani |
| Landscape Types | Plains & Valleys, Wide Wadis |
| Vegetation Types | Steppe, Herbaceous |
| Vegetation Densities | Low |
| Nest Locations | Ground |
| Diet Types | Generalist |
| Foraging Grounds | Ground |
| Body Sizes | Large (over 1000g) |
| Threat Factors | Nest Harvesting, Hunting and trapping |
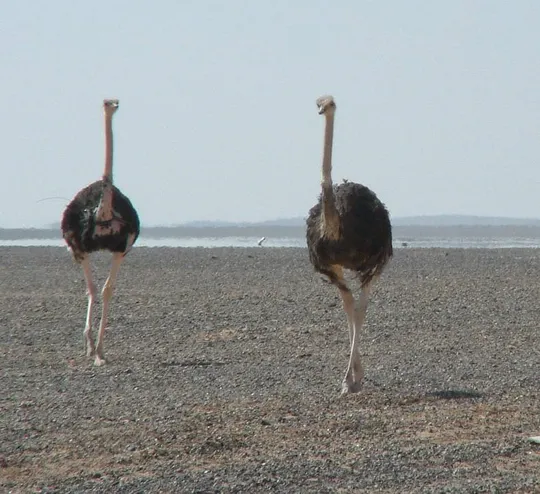
The Arabian Ostrich is the largest living bird on earth today. Its body length is about two meters and it weighs about 150 kg. It has small wings relative to its body size, and does not fly, but uses its wings to make sharp stops and turns when running. It is an omnivore feeding on grass, seeds, insects and small vertebrates. Its current distribution area is restricted to Africa.
Until the early 20th century, the Arabian Ostrich was found in the Negev, although its exact population size is unknown. It apparently occupied steppe and grassy areas in the Northern Negev, the Jordan Valley, the Judean Lowlands and the Coastal Plain. The last individuals were hunted during the 1920s and the last record was of an individual captured and sold alive in the Be’er Sheva area in 1929 (Hardy 1946). An ancient nest, 5,000 years old was found in Tel Mikhal near Herzliya, evidence of the existence of the species in central Israel in the distant past (Paz 1986, Shirihai 1996).
The Arabian Ostrich inhabited open landscapes in steppe and desert areas.
Arabian Ostriches of the subspecies Struthio camelus camelus were brought to the Yotvata Hai Bar in 1973 to establish a breeding nucleus. The ostriches reproduced successfully but the reintroduction efforts failed and the birds did not survive for long in nature.
The Arabian Ostrich of the subspecies S. c. syriacus became extinct by the 1940s (Cramp & Simons 1977). In Israel, it became extinct earlier during the 1920s. The reasons for extinction were hunting and collecting; some of the birds were sold in markets and kept as farm animals.
- פז, ע. 1986. עופות. מתוך אלון, ע. (עורך), החי והצומח של ארץ ישראל. כרך 6. הוצאת משרד הביטחון, ישראל.
- Cramp, S and Simmons, R.G. 1977. The Birds of the Western Palearctic, Volume 1. Oxford University Press
- Shirihai, H., 1996. The Birds of Israel. Academic Press, London.
- Symes, A. 2013. Species generation lengths. Unpublished, BirdLife International.
- Species page at Birdlife International
Distribution maps
The maps presented here provide visual information on the distribution of species in Israel from the past and present, and the changes in occupancy and breeding density during the comparison period. For further reading
Relative Abundance 2010-2020
Breeding density values in the current decade as determined from experts' opinion and observations from databases.
| Data Missing | Sporadic | Limited Sites | Low Density | High Density |
|---|---|---|---|---|
| 8 | 12 | 12 | 21 | 19 |
Relative Abundance 1980-1990
Density values based primarily on the book The Birds of Israel (Shirihai 1996).
| Data Missing | Sporadic | Limited Sites | Low Density | High Density |
|---|---|---|---|---|
| 5 | 14 | 14 | 17 | 22 |
Occupancy 1990-2020
The map shows differences in the species breeding distribution between the 1980's breeding map and the current weighted breeding evaluation. Negative value - species previously bred in the grid and is not presently breeding; positive value - species has not previously bred in the grid and is currently breeding.
| Data Missing | No Change | Occupancy Increase | Occupancy Decrease |
|---|---|---|---|
| 6 | 35 | 1 | 9 |
Change in Relative Abundance 1990-2020
The map shows the changes in the relative abundance of a species in each of the distribution grids between the breeding map of the 1980s and the weighted current breeding evaluation. Negative values - decline in abundance; positive values - increase in abundance; zero - no change in abundance.
| 80 to 100 | 50 | 20 to 30 | No Change | 30- to 20- | 50- | 100- to 80- | Data Missing |
|---|---|---|---|---|---|---|---|
| 0 | 4 | 2 | 22 | 12 | 14 | 11 | 16 |
| Rarity | |
|---|---|
| Vulnerability | |
| Attractiveness | |
| Endemism | |
| Red number | |
| Peripherality | |
| IUCN category | |
| Threat Definition according to the red book |


