Anthus similis
 Vulnerable
 Contributed:
| Habitats | Rocky Terrain, Mediterranean Batha, Semi-desert Batha, Mountainous Terrain |
|---|---|
| Presence In Israel | Resident |
| Breeding In Israel | Breeder |
| Migration Types | Resident |
| Zoographical Zones | Mediterranean, Irano-Turanian |
| Landscape Types | Mountainous, Rugged Terrain |
| Vegetation Types | Mediterranean Garrigue, Steppe, Herbaceous |
| Vegetation Densities | Low |
| Nest Locations | Ground |
| Diet Types | Invertebrate |
| Foraging Grounds | Ground |
| Body Sizes | Small (up to 500g) |
| Threat Factors | Wildfires, Tree planting, Habitat loss and fragmentation |
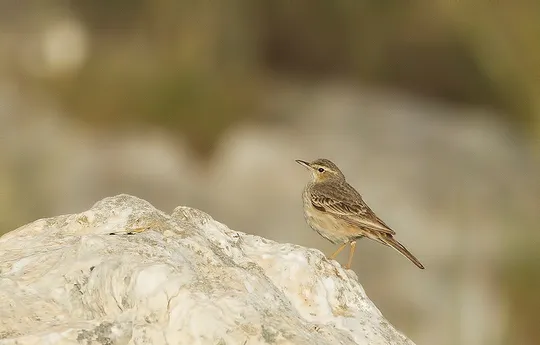
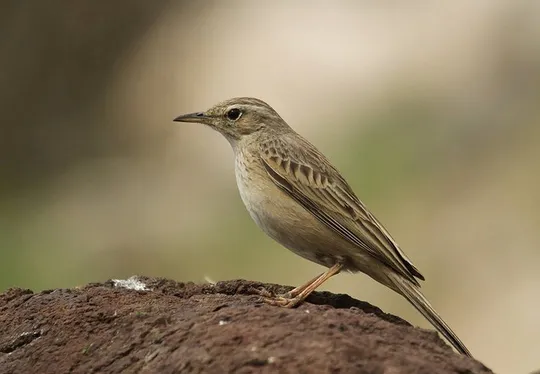
The Long-billed Pipit is resident in mountainous and hilly areas in Israel’s Mediterranean and Steppe regions, at altitudes of 250-700 meters. In recent decades has disappeared from Mt. Carmel, large areas in Western Judea and Samaria and most of the Western Galilee.
The Long-billed Pipit occupies shrubland (Batha and Garrigue) on rocky slopes in the Mediterranean region and the desert transition area.
Direct disturbance – mainly by military activity, shepherds and hikers.
Afforestation that reduce and fragment shrublands. Long-billed Pipits do not nest in planted areas or in adjacent areas, and they require shrubland patches extending at least over 50 hectares (Shochat 2000).
Wildfires in shrublands – mainly due to military exercises.
Closing of native woodland – reduced grazing in northern Israel leads to closing of woodland and the resulting habitats are not suitable for the pipits.
No specific conservation measures have been taken for this species to date.
Preserving shrubland patches greater than 50 hectares and avoiding habitat fragmentation caused by development and afforestation.
- מירוז, א. 2008. סיכום סקר ציפורים בשמורת סנסן אביב 2008. דו"ח רשות הטבע והגנים ומרכז הצפרות של החברה להגנת הטבע.
- מירוז, א. 2013. סיכום סקר ציפורים במזרח לכיש, אביב 2013. דו"ח רשות הטבע והגנים.
- מירוז, א. ושוחט, א. 2014. סיכום סקר ציפורים סביב היישוב נטע במזרח לכיש – 2014. דו"ח רשות הטבע והגנים.
- מירוז, א., 2007 . סיכום סקר ציפורים בגבעות גומר. דו"ח עבור רשות הטבע והגנים.
- פז, ע. 1986. עופות. מתוך אלון, ע. (עורך), החי והצומח של ארץ ישראל. כרך 6. הוצאת משרד הביטחון, ישראל.
- צורים ע., מירוז, א., 2006 . סיכום סקר ציפורים באזור נחל אדוריים. דו"ח עבור רשות הטבע והגנים.
- שוחט, א. 2000. השפעת קיטוע בתות הספר על ידי חורש נטוע על חברת העופות בצפון הנגב. חיבור לקבלת תואר דוקטור. אוניברסיטת בן-גוריון.
- Shirihai, H., 1996. The Birds of Israel. Academic Press, London.
- Shochat, E., Abramski, Z., Pinshow, B., 2001. Breeding bird species diversity in the Negev: Effects of Scrub Fragmentation by planted forests. Journal of Applied Ecology, 38, 1135-1147.
- Symes, A. 2013. Species generation lengths. Unpublished, BirdLife International.
- Species page at Birdlife International
Contributed:
Current Occupancy Map
| Data Missing | Sporadic | Limited Sites | Low Density | High Density |
|---|---|---|---|---|
| 0 | 0 | 0 | 0 | 0 |
Distribution maps
The maps presented here provide visual information on the distribution of species in Israel from the past and present, and the changes in occupancy and breeding density during the comparison period. For further reading
Relative Abundance 2010-2020
Breeding density values in the current decade as determined from experts' opinion and observations from databases.
| Data Missing | Sporadic | Limited Sites | Low Density | High Density |
|---|---|---|---|---|
| 8 | 12 | 12 | 21 | 19 |
Relative Abundance 1980-1990
Density values based primarily on the book The Birds of Israel (Shirihai 1996).
| Data Missing | Sporadic | Limited Sites | Low Density | High Density |
|---|---|---|---|---|
| 5 | 14 | 14 | 17 | 22 |
Occupancy 1990-2020
The map shows differences in the species breeding distribution between the 1980's breeding map and the current weighted breeding evaluation. Negative value - species previously bred in the grid and is not presently breeding; positive value - species has not previously bred in the grid and is currently breeding.
| Data Missing | No Change | Occupancy Increase | Occupancy Decrease |
|---|---|---|---|
| 6 | 35 | 1 | 9 |
Change in Relative Abundance 1990-2020
The map shows the changes in the relative abundance of a species in each of the distribution grids between the breeding map of the 1980s and the weighted current breeding evaluation. Negative values - decline in abundance; positive values - increase in abundance; zero - no change in abundance.
| 80 to 100 | 50 | 20 to 30 | No Change | 30- to 20- | 50- | 100- to 80- | Data Missing |
|---|---|---|---|---|---|---|---|
| 0 | 4 | 2 | 22 | 12 | 14 | 11 | 16 |
| Rarity | |
|---|---|
| Vulnerability | |
| Attractiveness | |
| Endemism | |
| Red number | |
| Peripherality | |
| IUCN category | |
| Threat Definition according to the red book |


