Calandrella cinerea
 Vulnerable
 Contributed:
| Presence In Israel | Summer |
|---|---|
| Breeding In Israel | Breeder |
| Migration Types | Long Range |
| Zoographical Zones | Mediterranean, Irano-Turanian |
| Landscape Types | Plains & Valleys, Wide Wadis |
| Vegetation Types | Cropland, Herbaceous |
| Vegetation Densities | Low |
| Nest Locations | Ground |
| Diet Types | Herbivore |
| Foraging Grounds | Ground |
| Body Sizes | Small (up to 500g) |
| Threat Factors | Habitat destruction in migration and wintering areas, Habitat loss and fragmentation, Nest destruction by agricultural activity, Tree planting |
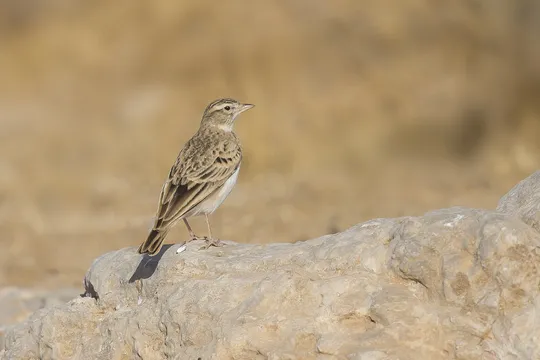
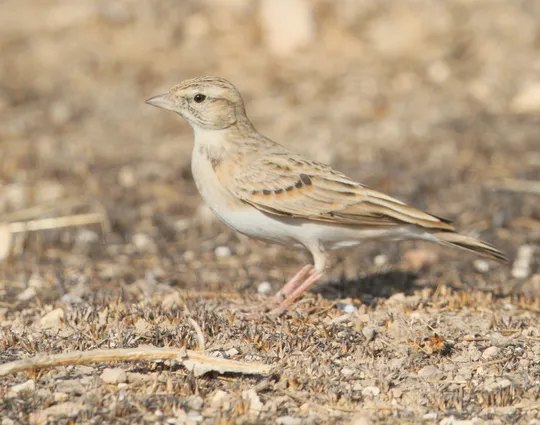
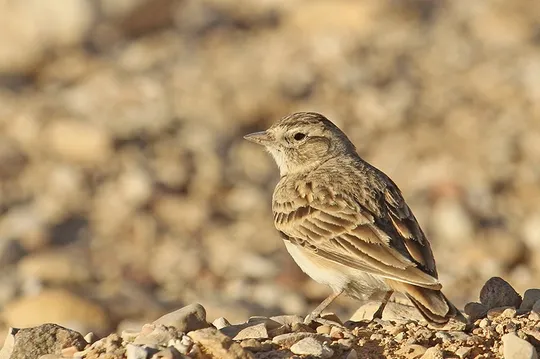
The Greater Short-toed Lark is a relatively small, pale lark with delicate streaking, which frequently forms flocks. Its plumage is relatively variable – some individuals are greyish-sandy, while others have a richer rustier hue. It has a relatively thick, but pointed bill and a delicate face pattern. Occasionally a dark patch appears on the sides of the breast. Flight call is hoarse and intermittent, frequently discloses its presence.
The Greater Short-toed Lark is a common passage migrant throughout Israel in spring and autumn. Breeds locally and in low densities in the Golan Heights, Eastern Galilee, on Mt. Gilboa and in the Jordan Valley, as well as in the Northern and Central Negev. The number of breeding pairs and their distribution varies greatly from year to year.
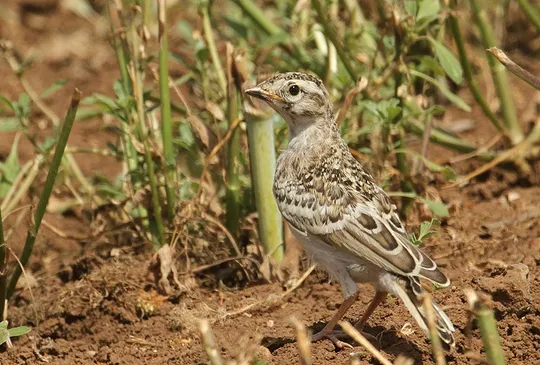
The Greater Short-toed Lark nests in open dry fields, often at the edges of cultivated fields as well as in desert plains with low vegetation.
No specific conservation measures have been taken for this species to date.
The Greater Short-toed Lark is a nomadic species that breeds in “green patches” in the Negev and at the edges of cultivated fields with suitable cultivation regimes. Detailed surveys are necessary for a better understanding of the factors limiting the population and suggesting ways of preserving the species.
- פז, ע. 1986. עופות. מתוך אלון, ע. (עורך), החי והצומח של ארץ ישראל. כרך 6. הוצאת משרד הביטחון, ישראל.
- פרלמן, י., אלתרמן, ש. וגרניט, ב. 2011. סקר עופות דוגרים בנחלים הפנימיים, אביב 2011. דו"ח מרכז הצפרות של החברה להגנת הטבע.
- Shirihai, H., 1996. The Birds of Israel. Academic Press, London.
- Symes, A. 2013. Species generation lengths. Unpublished, BirdLife International.
- Species page at Birdlife International
Contributed:
Current Occupancy Map
| Data Missing | Sporadic | Limited Sites | Low Density | High Density |
|---|---|---|---|---|
| 0 | 0 | 0 | 0 | 0 |
Distribution maps
The maps presented here provide visual information on the distribution of species in Israel from the past and present, and the changes in occupancy and breeding density during the comparison period. For further reading
Relative Abundance 2010-2020
Breeding density values in the current decade as determined from experts' opinion and observations from databases.
| Data Missing | Sporadic | Limited Sites | Low Density | High Density |
|---|---|---|---|---|
| 8 | 12 | 12 | 21 | 19 |
Relative Abundance 1980-1990
Density values based primarily on the book The Birds of Israel (Shirihai 1996).
| Data Missing | Sporadic | Limited Sites | Low Density | High Density |
|---|---|---|---|---|
| 5 | 14 | 14 | 17 | 22 |
Occupancy 1990-2020
The map shows differences in the species breeding distribution between the 1980's breeding map and the current weighted breeding evaluation. Negative value - species previously bred in the grid and is not presently breeding; positive value - species has not previously bred in the grid and is currently breeding.
| Data Missing | No Change | Occupancy Increase | Occupancy Decrease |
|---|---|---|---|
| 6 | 35 | 1 | 9 |
Change in Relative Abundance 1990-2020
The map shows the changes in the relative abundance of a species in each of the distribution grids between the breeding map of the 1980s and the weighted current breeding evaluation. Negative values - decline in abundance; positive values - increase in abundance; zero - no change in abundance.
| 80 to 100 | 50 | 20 to 30 | No Change | 30- to 20- | 50- | 100- to 80- | Data Missing |
|---|---|---|---|---|---|---|---|
| 0 | 4 | 2 | 22 | 12 | 14 | 11 | 16 |
| Rarity | |
|---|---|
| Vulnerability | |
| Attractiveness | |
| Endemism | |
| Red number | |
| Peripherality | |
| IUCN category | |
| Threat Definition according to the red book |


