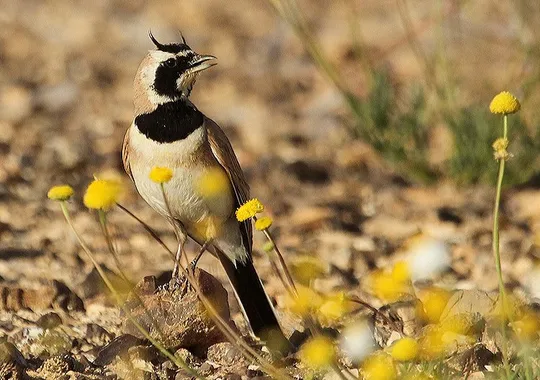
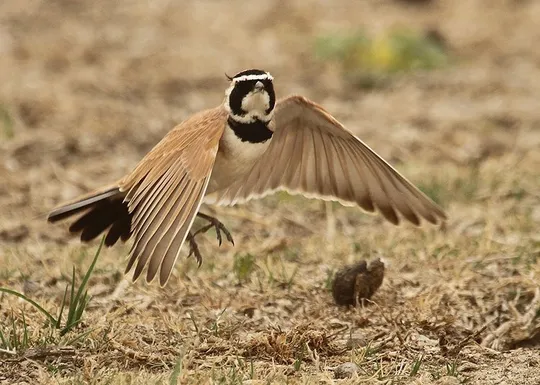
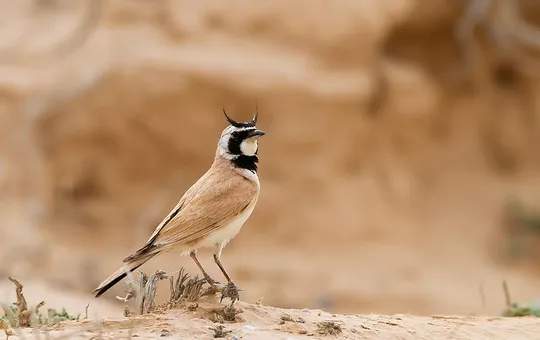
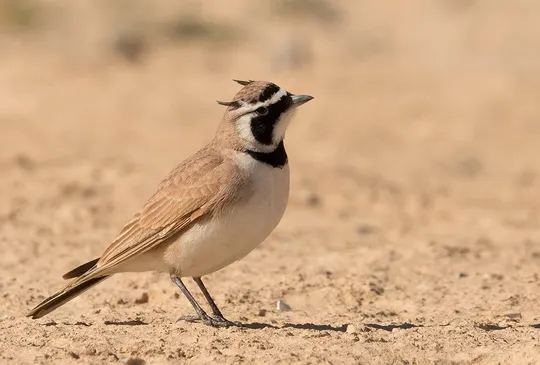
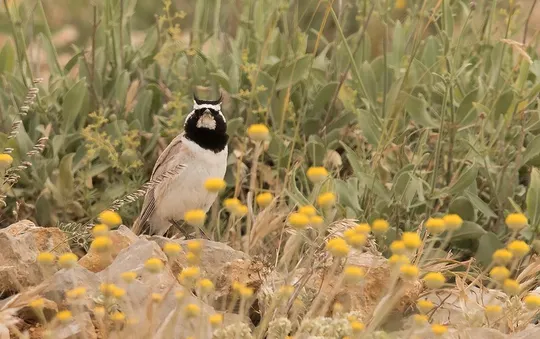
Eremophila bilopha
 Vulnerable
 Contributed:
| Habitats | Desert Plains, Inland Sand Dunes |
|---|---|
| Presence In Israel | Summer, Migrant |
| Breeding In Israel | Breeder |
| Migration Types | Nomad, Short Range / Partial |
| Zoographical Zones | Saharo-Arabian |
| Landscape Types | Plains & Valleys, Wide Wadis, Sand Dunes |
| Vegetation Densities | Low |
| Nest Locations | Ground |
| Diet Types | Invertebrate, Herbivore |
| Foraging Grounds | Ground |
| Body Sizes | Small (up to 500g) |
| Threat Factors | Tree planting, Habitat loss and fragmentation, Direct disturbance from human activity |
Temminck’s Lark is a summer breeder and a rare passage migrant; a small portion of the population is probably resident. The distribution of breeding pairs varies from year to year, probably related to variations in precipitation and seasonal vegetation. It nests in Israel’s desert region: in the Western Negev in the Nitsana and Shivta area, in the Central Negev in the area of the Makhteshim, the Meshar and the Paran flats (rarely in the Tsin Valley as well) and in the Southern Negev in the large wadis and the Sayarim Valley. In each of these regions, nesting is sparse and fluctuates sharply from year to year. In the past, the species was far more common. In the 1960s and 1970s, hundreds of pairs nested throughout the Negev and the Arava, including several tens of birds that nested regularly in the Nitsana area. During the 1980s, the number of Temminck’s Larks in the Western Negev decreased to just a few pairs, apparently because of the lack of undisturbed suitable habitats (Shirihai 1996). In the 1990s, breeding in the Arava ceased as well.
Wide wadis, sandy and loess plains and hamada flats, occasionally with sparse vegetation in extreme desert areas.
Habitat modification – stabilization of shifting sands in the Western Negev and conversion of sandy and loess plains in the Negev and the Arava to settled and farmed areas, has considerably reduced the habitats suitable for Temminck’s Lark.
Direct disturbance – by military activity, grazing and hikers.
No specific conservation measures have been taken for this species to date.
- פז, ע. 1986. עופות. מתוך אלון, ע. (עורך), החי והצומח של ארץ ישראל. כרך 6. הוצאת משרד הביטחון, ישראל.
- פרלמן, י., אלתרמן, ש. וגרניט, ב. 2011. סקר עופות דוגרים בנחלים הפנימיים, אביב 2011. דו"ח מרכז הצפרות של החברה להגנת הטבע.
- פרלמן, י., שוחט, א. ולבינגר, ז. 2009. סקר אטלס ציפורים בערבה סיכום שנת 2009. דו"ח מרכז הצפרות של החברה להגנת הטבע.
- Perlman, Y., Shochat, E. and Labinger, Z. 2011. Developing Managment plan for important bird areas in southern Israel. second annual report, Nizzana region and Arava Valley.Israeli Ornithological center, SPNI.
- Shirihai, H., 1996. The Birds of Israel. Academic Press, London.
- Symes, A. 2013. Species generation lengths. Unpublished, BirdLife International.
- Species page at Birdlife International
Contributed:
Current Occupancy Map
| Data Missing | Sporadic | Limited Sites | Low Density | High Density |
|---|---|---|---|---|
| 0 | 0 | 0 | 0 | 0 |
Distribution maps
The maps presented here provide visual information on the distribution of species in Israel from the past and present, and the changes in occupancy and breeding density during the comparison period. For further reading
Relative Abundance 2010-2020
Breeding density values in the current decade as determined from experts' opinion and observations from databases.
| Data Missing | Sporadic | Limited Sites | Low Density | High Density |
|---|---|---|---|---|
| 8 | 12 | 12 | 21 | 19 |
Relative Abundance 1980-1990
Density values based primarily on the book The Birds of Israel (Shirihai 1996).
| Data Missing | Sporadic | Limited Sites | Low Density | High Density |
|---|---|---|---|---|
| 5 | 14 | 14 | 17 | 22 |
Occupancy 1990-2020
The map shows differences in the species breeding distribution between the 1980's breeding map and the current weighted breeding evaluation. Negative value - species previously bred in the grid and is not presently breeding; positive value - species has not previously bred in the grid and is currently breeding.
| Data Missing | No Change | Occupancy Increase | Occupancy Decrease |
|---|---|---|---|
| 6 | 35 | 1 | 9 |
Change in Relative Abundance 1990-2020
The map shows the changes in the relative abundance of a species in each of the distribution grids between the breeding map of the 1980s and the weighted current breeding evaluation. Negative values - decline in abundance; positive values - increase in abundance; zero - no change in abundance.
| 80 to 100 | 50 | 20 to 30 | No Change | 30- to 20- | 50- | 100- to 80- | Data Missing |
|---|---|---|---|---|---|---|---|
| 0 | 4 | 2 | 22 | 12 | 14 | 11 | 16 |
| Rarity | |
|---|---|
| Vulnerability | |
| Attractiveness | |
| Endemism | |
| Red number | |
| Peripherality | |
| IUCN category | |
| Threat Definition according to the red book |


