Falco biarmicus
 Critically Endangered
| Habitats | Desert Cliffs |
|---|---|
| Presence In Israel | Resident |
| Breeding In Israel | Breeder |
| Migration Types | Resident |
| Zoographical Zones | Saharo-Arabian, Sudani |
| Landscape Types | Cliffs |
| Vegetation Densities | Low |
| Nest Locations | Cliffs |
| Diet Types | Terrestrial Vertebrates |
| Foraging Grounds | Ground, Aerial |
| Body Sizes | Medium (500 - 1000g) |
| Threat Factors | Nest Harvesting, Human Settlements in Gorges, Hikers and rock climbers, Pesticide Poisoning, Lead Poisoning, Hunting and trapping |
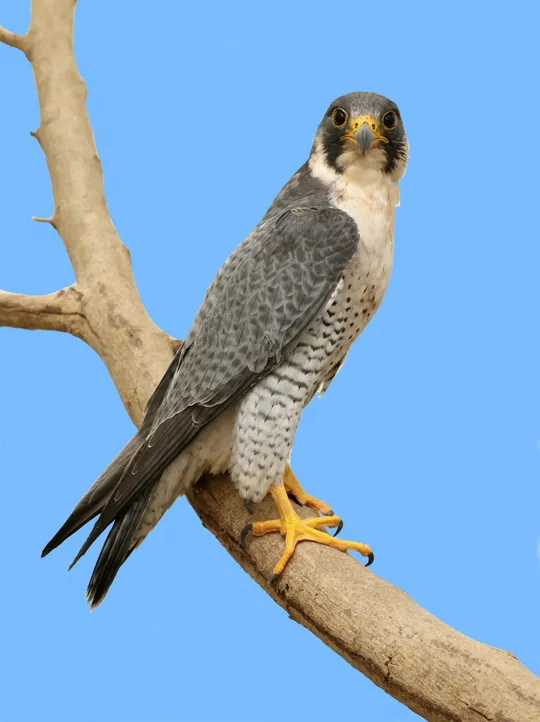
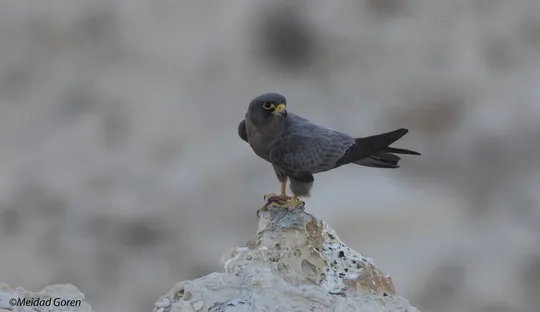
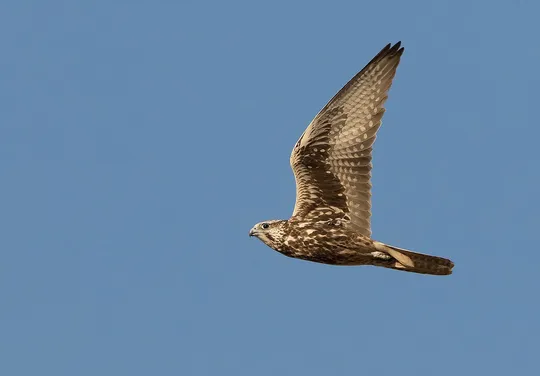
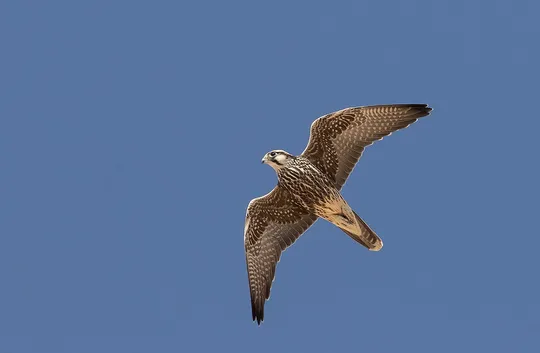
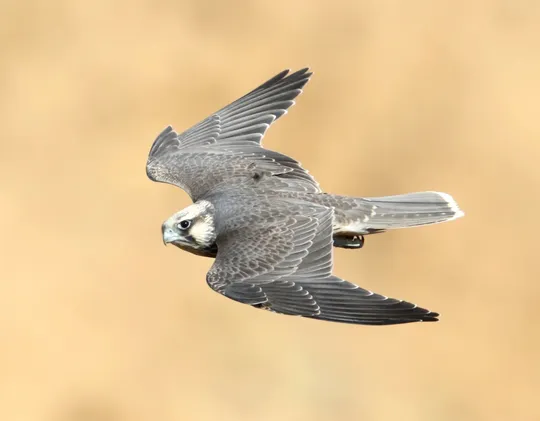
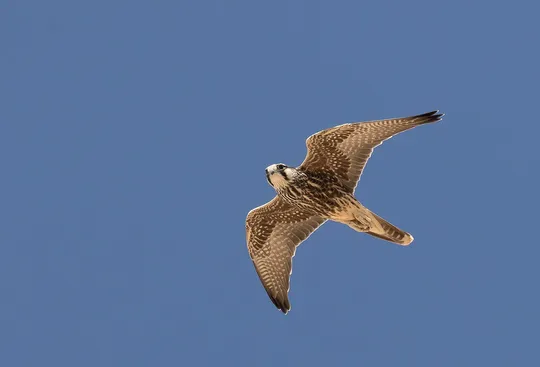
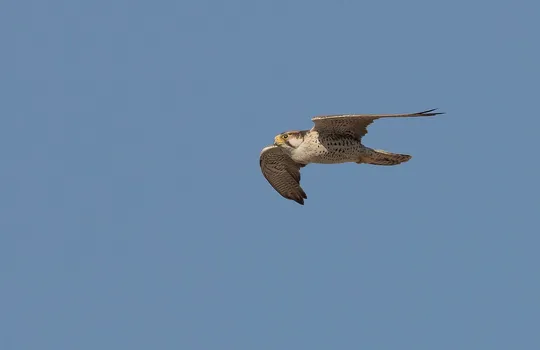
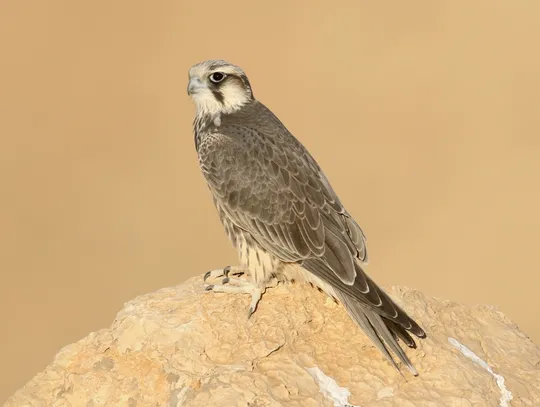
The Lanner Falcon is a large and long-winged falcon, the largest falcon breeding in our region. It is a fast, aggressive raptor that hunts small birds on the wing, as well as birds and mammals on the ground. Territorial pairs often hunt together. Upper parts are dark, grey or brown, and underparts are cream colored, with delicate dark streaking. It can be recognized by its reddish cap and narrow black moustache.
A rare resident in Israel’s desert region, particularly in the Judean Desert, the Negev Highlands, the Eastern Negev and the Arava cliffs. Until the mid-20th century, it nested in most of the cliffs in Israel, both in the desert and on Mt. Carmel and the Galilee. The population in northern Israel comprised at least 30 pairs (Hatsofe et al. 2005). It disappeared during the 1960s and 1970s, mainly due to poisoning. During the last three decades, the species gradually disappeared from Eastern Samaria, the northern Judean Desert (north of Nahal Kedem), the western Negev Highlands and the southern Arava.
The Lanner Falcon nests on cliffs near open landscapes, particularly in arid areas, but also in marshes, lakes and even in forested areas – as long as there are open areas suitable for hunting nearby.
In the late 1980s the Lanner Falcon population was estimated at 25 to 30 pairs (Shirihai 1996). Today the number of breeding pairs is estimated at 15 to 20, of which 8 pairs are in the southern Judean Desert and 8-10 pairs in the eastern and southern Negev (Mayrose & Hatsofe 2017).
In the second half of the 20th century, almost the entire breeding population in Israel’s Mediterranean region was decimated because of secondary poisoning by agricultural pesticides. The Lanner Falcons that bred in eastern Samaria were affected by nest robbing and loss of nesting sites due to sheep herding activity in steep wadis. In addition, there is evidence that juveniles roaming to distant sites are harmed by hunting and captured for falconry both in Israel and in neighboring countries (Ohad Hatsofe, pers. comm.)
Since 1990, efforts have been made to rehabilitate the Lanner Falcon population and to reintroduce it to Israel’s Mediterranean region. In the Carmel Hai Bar, there is breeding nucleus of Lanner Falcons and every year a number of immature birds are released into nature. In 1999 a pair of falcons from the breeding nucleus was observed nesting at the Hadera Power Plant, and in 2003 and 2004 Lanner Falcons apparently nested in Nahal Kziv (Hatsofe et al. 2005).
The Lanner Falcon is classified as Critically Endangered (CR), because its population is extremely small and limited to relatively undisturbed desert areas (in the southern Judean Desert and in the Eastern Negev). For the past three decades, efforts have been made to reintroduce and rehabilitate the species, but Lanner Falcons have still not return to breed regularly in Israel’s Mediterranean region. The decision whether to continue with the reintroduction efforts depends on understanding the movement patterns of immature falcons and the threat factors resulting from them.
There is insufficient information regarding the areas in which juvenile Lanner Falcons disperse and the resulting threat factors. This information can be obtained by telemetry study of both captive and wild born individuals.
- הצופה, א. ומירוז, א. 2015. תכנית אב לשימור העופות הדורסים בישראל. מסמך פנימי של רשות הטבע והגנים.
- הצופה, א., וודלי, ב. ומילר, י. 2005. השבת בזי צוקים לחבל הים-תיכוני בישראל. העזניה 33, הוצאת טבע הדברים והחברה להגנת הטבע.
- הרלינג, א. 2001. סיכום סקר קינון דורסי יום בשמורת עין גדי. דו"ח רשות הטבע והגנים.
- מירוז, א. והצופה, א. 2014. סיכום סקר קינון עופות דורסים במדבר יהודה. דו"ח רשות הטבע והגנים.
- פז, ע. 1986. עופות. מתוך אלון, ע. (עורך), החי והצומח של ארץ ישראל. כרך 6. הוצאת משרד הביטחון, ישראל.
- פרומקין, ר., מן ש., 1984 .קנון דורסים בחבל המדברי של ישראל 1984-1980. העזניה גליון 11. הוצאת החברה להגנת הטבע.
- פרלמן, י., אלתרמן, ש. וגרניט, ב. 2011. סקר עופות דוגרים בנחלים הפנימיים, אביב 2011. דו"ח מרכז הצפרות של החברה להגנת הטבע.
- פרלמן, י., שוחט, א. ולבינגר, ז. 2009. סקר אטלס ציפורים בערבה סיכום שנת 2009. דו"ח מרכז הצפרות של החברה להגנת הטבע.
- Mendelssohn, H. 1975. Report on the Status of Some Bird Species in Israel in 1974. I.C.B.P. 12:265-270.
- Shirihai, H., 1996. The Birds of Israel. Academic Press, London.
- Symes, A. 2013. Species generation lengths. Unpublished, BirdLife International.
- Species page at Birdlife International
Current Occupancy Map
| Data Missing | Sporadic | Limited Sites | Low Density | High Density |
|---|---|---|---|---|
| 0 | 0 | 0 | 0 | 0 |
Distribution maps
The maps presented here provide visual information on the distribution of species in Israel from the past and present, and the changes in occupancy and breeding density during the comparison period. For further reading
Relative Abundance 2010-2020
Breeding density values in the current decade as determined from experts' opinion and observations from databases.
| Data Missing | Sporadic | Limited Sites | Low Density | High Density |
|---|---|---|---|---|
| 8 | 12 | 12 | 21 | 19 |
Relative Abundance 1980-1990
Density values based primarily on the book The Birds of Israel (Shirihai 1996).
| Data Missing | Sporadic | Limited Sites | Low Density | High Density |
|---|---|---|---|---|
| 5 | 14 | 14 | 17 | 22 |
Occupancy 1990-2020
The map shows differences in the species breeding distribution between the 1980's breeding map and the current weighted breeding evaluation. Negative value - species previously bred in the grid and is not presently breeding; positive value - species has not previously bred in the grid and is currently breeding.
| Data Missing | No Change | Occupancy Increase | Occupancy Decrease |
|---|---|---|---|
| 6 | 35 | 1 | 9 |
Change in Relative Abundance 1990-2020
The map shows the changes in the relative abundance of a species in each of the distribution grids between the breeding map of the 1980s and the weighted current breeding evaluation. Negative values - decline in abundance; positive values - increase in abundance; zero - no change in abundance.
| 80 to 100 | 50 | 20 to 30 | No Change | 30- to 20- | 50- | 100- to 80- | Data Missing |
|---|---|---|---|---|---|---|---|
| 0 | 4 | 2 | 22 | 12 | 14 | 11 | 16 |
| Rarity | |
|---|---|
| Vulnerability | |
| Attractiveness | |
| Endemism | |
| Red number | |
| Peripherality | |
| IUCN category | |
| Threat Definition according to the red book |
 Contributed: