Falco concolor
 Near Threatened
 Contributed:
| Habitats | Desert Cliffs |
|---|---|
| Presence In Israel | Migrant, Summer |
| Breeding In Israel | Breeder |
| Migration Types | Long Range |
| Zoographical Zones | Saharo-Arabian |
| Landscape Types | Cliffs |
| Vegetation Densities | Low |
| Nest Locations | Cliffs |
| Diet Types | Terrestrial Vertebrates |
| Foraging Grounds | Aerial |
| Body Sizes | Small (up to 500g) |
| Threat Factors | Hikers and rock climbers, Helicopter and aircraft activity in breeding areas, Direct disturbance from human activity |
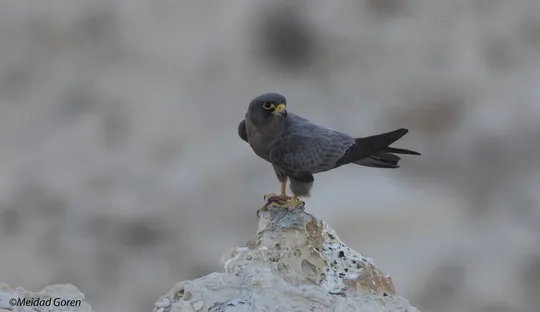
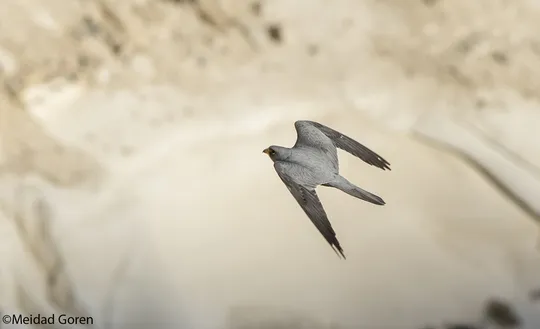
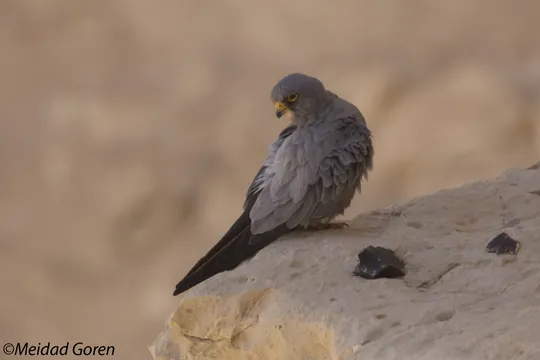
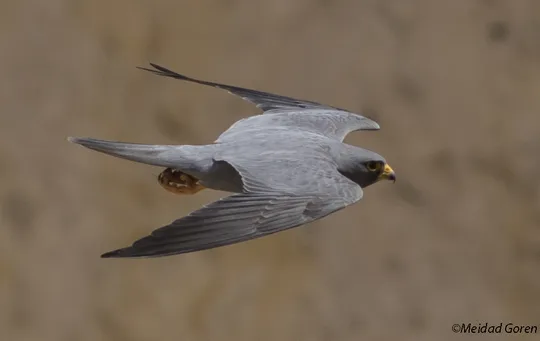
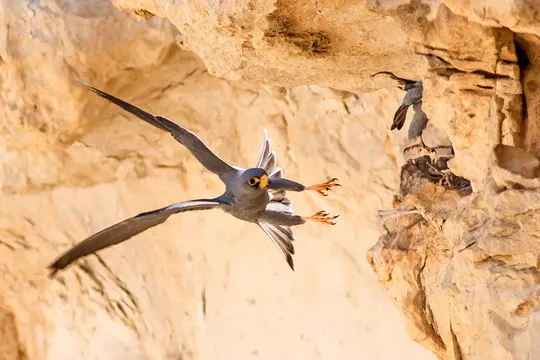
The Sooty Falcon is a slim, elegant long-winged falcon that nests on arid desert cliffs, occasionally near seacoasts. The mature bird is blackish-dark grey, with the exception of its legs, eye ring and cere that are bright yellow. In flight, it is identified by its long sharp silhouette and its tendency to glide on half-closed wings. It specializes in catching birds and bats in flight. Nesting occurs late in the summer to coincide with autumn migration of small passerine that provide food for their young.
The Sooty Falcon is a relatively rare summer breeder in the Eilat Mountains, the Arava, the Negev Highlands and the Judean Desert north to Nahal Arugot (Frumkin & Man 1984, Shirihai 1996, Goren & Granit 2014).
- גורן, מ. וגרניט, ב. 2014. סקר קינון בזים שחורים בחבל המדברי של ישראל, 2011-2014. דו"ח רשות הטבע והגנים ומרכז הצפרות של החברה להגנת הטבע.
- גרניט, ב., גורן, מ. ושני, א., 2011. סקר קינון בזים שחורים בנגב, דרום מדבר יהודה והרי אילת, סתיו 2011. דו"ח רשות הטבע והגנים ומרכז הצפרות של החברה להגנת הטבע.
- פז, ע. 1986. עופות. מתוך אלון, ע. (עורך), החי והצומח של ארץ ישראל. כרך 6. הוצאת משרד הביטחון, ישראל.
- פרלמן, י., שוחט, א. ולבינגר, ז. 2009. סקר אטלס ציפורים בערבה סיכום שנת 2009. דו"ח מרכז הצפרות של החברה להגנת הטבע.
- Shirihai, H., 1996. The Birds of Israel. Academic Press, London.
- Symes, A. 2013. Species generation lengths. Unpublished, BirdLife International.
- Species page at Birdlife International
Contributed:
Current Occupancy Map
| Data Missing | Sporadic | Limited Sites | Low Density | High Density |
|---|---|---|---|---|
| 0 | 0 | 0 | 0 | 0 |
Distribution maps
The maps presented here provide visual information on the distribution of species in Israel from the past and present, and the changes in occupancy and breeding density during the comparison period. For further reading
Relative Abundance 2010-2020
Breeding density values in the current decade as determined from experts' opinion and observations from databases.
| Data Missing | Sporadic | Limited Sites | Low Density | High Density |
|---|---|---|---|---|
| 8 | 12 | 12 | 21 | 19 |
Relative Abundance 1980-1990
Density values based primarily on the book The Birds of Israel (Shirihai 1996).
| Data Missing | Sporadic | Limited Sites | Low Density | High Density |
|---|---|---|---|---|
| 5 | 14 | 14 | 17 | 22 |
Occupancy 1990-2020
The map shows differences in the species breeding distribution between the 1980's breeding map and the current weighted breeding evaluation. Negative value - species previously bred in the grid and is not presently breeding; positive value - species has not previously bred in the grid and is currently breeding.
| Data Missing | No Change | Occupancy Increase | Occupancy Decrease |
|---|---|---|---|
| 6 | 35 | 1 | 9 |
Change in Relative Abundance 1990-2020
The map shows the changes in the relative abundance of a species in each of the distribution grids between the breeding map of the 1980s and the weighted current breeding evaluation. Negative values - decline in abundance; positive values - increase in abundance; zero - no change in abundance.
| 80 to 100 | 50 | 20 to 30 | No Change | 30- to 20- | 50- | 100- to 80- | Data Missing |
|---|---|---|---|---|---|---|---|
| 0 | 4 | 2 | 22 | 12 | 14 | 11 | 16 |
| Rarity | |
|---|---|
| Vulnerability | |
| Attractiveness | |
| Endemism | |
| Red number | |
| Peripherality | |
| IUCN category | |
| Threat Definition according to the red book |


