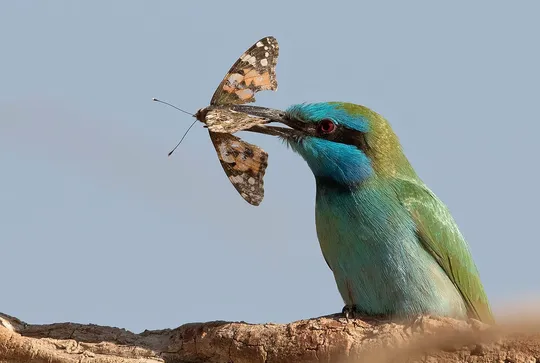
Merops superciliosus
 Critically Endangered
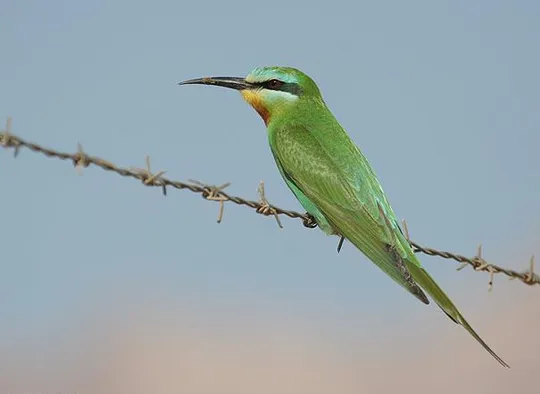
| Habitats | Salt Marsh, Rural Areas, Humid Lowlands, Loess Ravines |
|---|---|
| Presence In Israel | Migrant, Summer |
| Breeding In Israel | Breeder |
| Migration Types | Long Range |
| Zoographical Zones | Irano-Turanian, Sudani |
| Landscape Types | Plains & Valleys, Wide Wadis, Rural Area |
| Vegetation Types | Steppe, Herbaceous |
| Vegetation Densities | Low |
| Nest Locations | Mountainside |
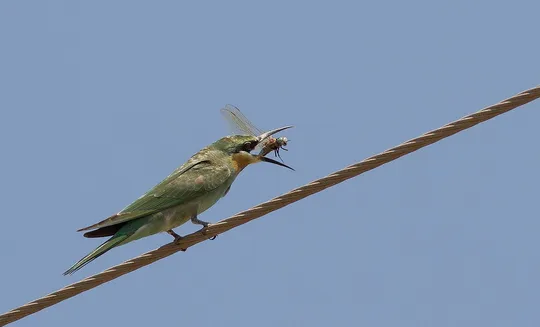
| Diet Types | Invertebrate |
| Foraging Grounds | Aerial |
| Body Sizes | Small (up to 500g) |
| Threat Factors | Pesticide Poisoning, Habitat loss and fragmentation |
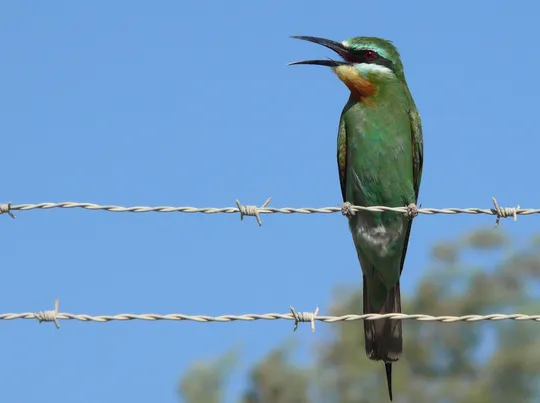
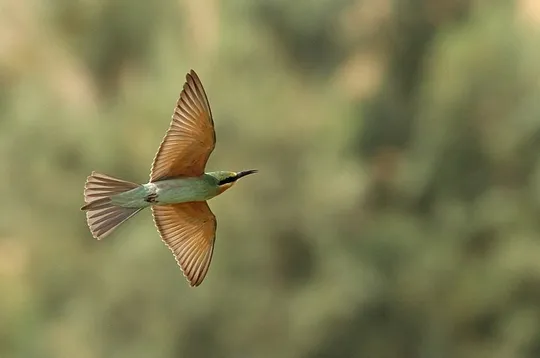
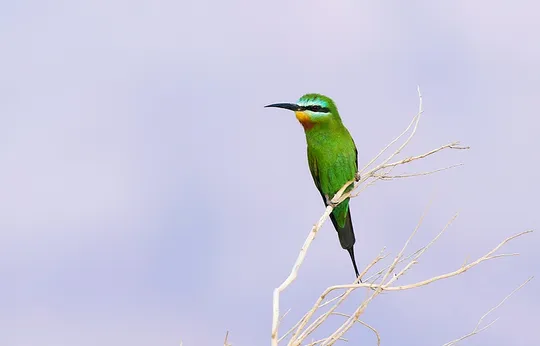
The Blue-cheeked Bee-eater is a rare summer breeder along the Jordan Valley and the Arava, between the Bet She’an Valley in the north to Grofit in the south. In the Ne’ot HaKikar and Sodom Salt Marsh area there are apparently a few breeding pairs (Yoav Perlman 2016 pers. comm.). About 5 pairs were seen along the Jordan River between Mehola and Jericho (Eli Haviv & Asaf Mayrose 2017, pers. comm.), 10-12 pairs were seen nesting in the Grofit area (Noam Weiss 2017, pers. comm.) and a single pair bred in Kerem-Shalom area (Eyal Shochat, pers. comm.). Thus, a rough estimate puts the breeding population in Israel at between about 18 and 30 pairs. Until the 1950s, the species was a relatively common breeder, in colonies of tens of pairs – in the Jordan, Bet She’an and Hula valleys, in the Golan Heights and the Zevulun Valley (Inbar 1975, Paz 1986, Shirihai 1996). During the 1960s, it disappeared from most of these regions, except for a few pairs in the Jordan and Bet She’an valleys. During the 1970s and 1980s there was a slight recovery, and 50-100 pairs were recorded breeding in the Jordan Valley, between Jericho and Bet She’an, some 10 pairs in the southern Golan and a single pair in Ne’ot HaKikar (Shirihai 1996).
No specific conservation measures have been taken for this species to date.
The Blue-cheeked Bee-eater was once a common summer breeder in the Northern Valleys and the Jordan Valley. Its population declined dramatically during the 1960s due to agricultural pesticide poisoning and the species became extremely rare. In recent years, it has been observed nesting along the Jordan Valley, the Arava and the Western Negev, including in sites from which it was not previously known, increasing the probability that the species population might grow and expand.
Breeding populations should be monitored. The main breeding area of the Blue-cheeked Bee-eater is along the Jordan River headwaters, an area that is not monitored regularly because of security issues.
- פז, ע. 1986. עופות. מתוך אלון, ע. (עורך), החי והצומח של ארץ ישראל. כרך 6. הוצאת משרד הביטחון, ישראל.
- Shirihai, H., 1996. The Birds of Israel. Academic Press, London.
- Symes, A. 2013. Species generation lengths. Unpublished, BirdLife International.
- Species page at Birdlife International
Current Occupancy Map
| Data Missing | Sporadic | Limited Sites | Low Density | High Density |
|---|---|---|---|---|
| 0 | 0 | 0 | 0 | 0 |
Distribution maps
The maps presented here provide visual information on the distribution of species in Israel from the past and present, and the changes in occupancy and breeding density during the comparison period. For further reading
Relative Abundance 2010-2020
Breeding density values in the current decade as determined from experts' opinion and observations from databases.
| Data Missing | Sporadic | Limited Sites | Low Density | High Density |
|---|---|---|---|---|
| 8 | 12 | 12 | 21 | 19 |
Relative Abundance 1980-1990
Density values based primarily on the book The Birds of Israel (Shirihai 1996).
| Data Missing | Sporadic | Limited Sites | Low Density | High Density |
|---|---|---|---|---|
| 5 | 14 | 14 | 17 | 22 |
Occupancy 1990-2020
The map shows differences in the species breeding distribution between the 1980's breeding map and the current weighted breeding evaluation. Negative value - species previously bred in the grid and is not presently breeding; positive value - species has not previously bred in the grid and is currently breeding.
| Data Missing | No Change | Occupancy Increase | Occupancy Decrease |
|---|---|---|---|
| 6 | 35 | 1 | 9 |
Change in Relative Abundance 1990-2020
The map shows the changes in the relative abundance of a species in each of the distribution grids between the breeding map of the 1980s and the weighted current breeding evaluation. Negative values - decline in abundance; positive values - increase in abundance; zero - no change in abundance.
| 80 to 100 | 50 | 20 to 30 | No Change | 30- to 20- | 50- | 100- to 80- | Data Missing |
|---|---|---|---|---|---|---|---|
| 0 | 4 | 2 | 22 | 12 | 14 | 11 | 16 |
| Rarity | |
|---|---|
| Vulnerability | |
| Attractiveness | |
| Endemism | |
| Red number | |
| Peripherality | |
| IUCN category | |
| Threat Definition according to the red book |
 Contributed: