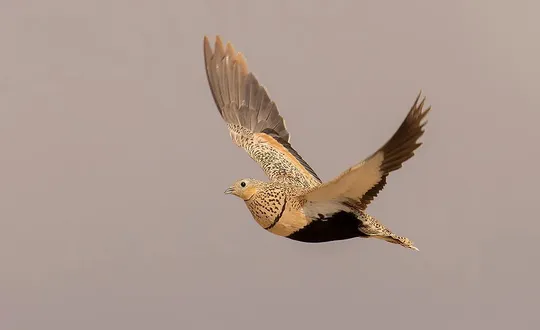
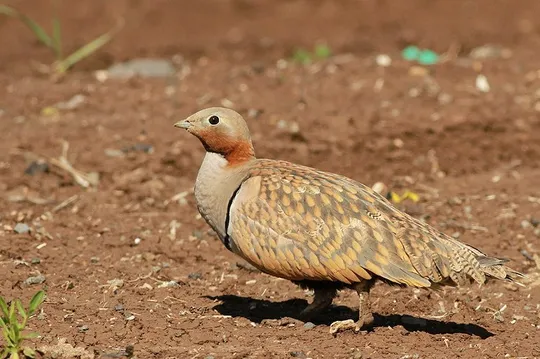
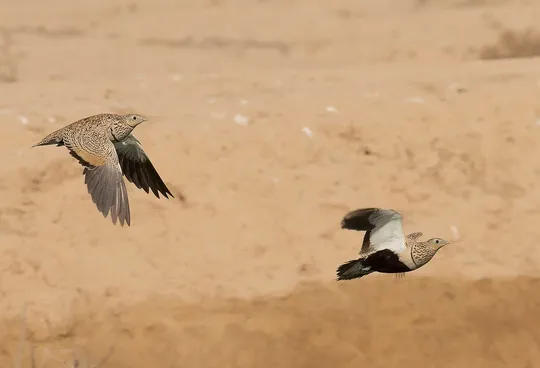
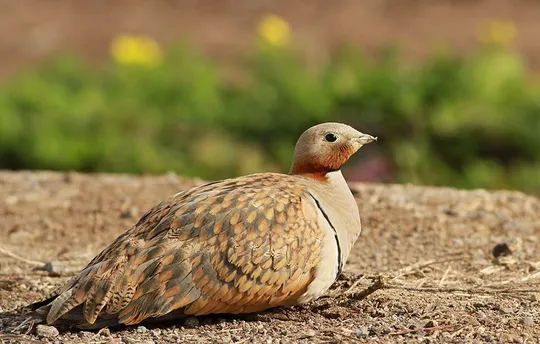
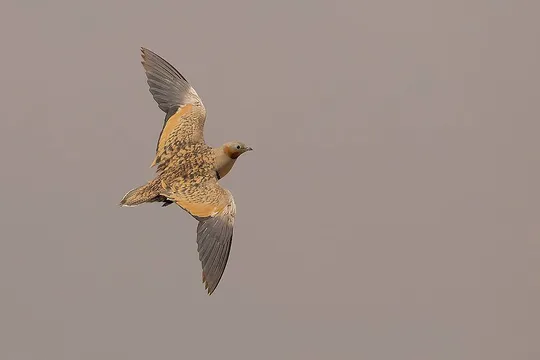
Pterocles orientalis
 Least Concern
 Contributed:
| Habitats | Desert Plains |
|---|---|
| Presence In Israel | Resident |
| Breeding In Israel | Breeder |
| Migration Types | Resident, Nomad |
| Zoographical Zones | Saharo-Arabian, Irano-Turanian |
| Landscape Types | Plains & Valleys, Wide Wadis |
| Vegetation Types | Cropland, Steppe, Herbaceous |
| Vegetation Densities | Low |
| Nest Locations | Ground |
| Diet Types | Herbivore |
| Foraging Grounds | Ground |
| Body Sizes | Small (up to 500g) |
| Threat Factors | Overgrazing, Habitat loss and fragmentation, Direct disturbance from human activity, Tree planting |
- פז, ע. 1986. עופות. מתוך אלון, ע. (עורך), החי והצומח של ארץ ישראל. כרך 6. הוצאת משרד הביטחון, ישראל.
- צורים ע, לב ק. ( 2008 ). שינויים בתפוצת הקטות בצפון מערב הנגב בעשורים האחרונים. פוסטר. רשות הטבע . והגנים, מחוז דרום. יום המדע אפריל 2008
- שוחט א, גרניט ב. ( 2010 ). סקר קטות בנגב – קיץ 2010 . דו"ח עבור מחוז דרום של רשות הטבע והגנים.
- שוחט, א. וגרניט, ב. 2011. סיכום סקר קטות באתרי שתיה בניצנה - קיץ 2011. דו"ח רשות הטבע והגנים, החברה להגנת הטבע ומרכז דוכיפת לצפרות ואקולוגיה בירוחם.
- Perlman, Y., Shochat, E. and Labinger, Z. 2011. Developing Managment plan for important bird areas in southern Israel. second annual report, Nizzana region and Arava Valley.Israeli Ornithological center, SPNI.
- Shirihai, H., 1996. The Birds of Israel. Academic Press, London.
- Symes, A. 2013. Species generation lengths. Unpublished, BirdLife International.
- Species page at Birdlife International
Contributed:
Current Occupancy Map
| Data Missing | Sporadic | Limited Sites | Low Density | High Density |
|---|---|---|---|---|
| 0 | 0 | 0 | 0 | 0 |
Distribution maps
The maps presented here provide visual information on the distribution of species in Israel from the past and present, and the changes in occupancy and breeding density during the comparison period. For further reading
Relative Abundance 2010-2020
Breeding density values in the current decade as determined from experts' opinion and observations from databases.
| Data Missing | Sporadic | Limited Sites | Low Density | High Density |
|---|---|---|---|---|
| 8 | 12 | 12 | 21 | 19 |
Relative Abundance 1980-1990
Density values based primarily on the book The Birds of Israel (Shirihai 1996).
| Data Missing | Sporadic | Limited Sites | Low Density | High Density |
|---|---|---|---|---|
| 5 | 14 | 14 | 17 | 22 |
Occupancy 1990-2020
The map shows differences in the species breeding distribution between the 1980's breeding map and the current weighted breeding evaluation. Negative value - species previously bred in the grid and is not presently breeding; positive value - species has not previously bred in the grid and is currently breeding.
| Data Missing | No Change | Occupancy Increase | Occupancy Decrease |
|---|---|---|---|
| 6 | 35 | 1 | 9 |
Change in Relative Abundance 1990-2020
The map shows the changes in the relative abundance of a species in each of the distribution grids between the breeding map of the 1980s and the weighted current breeding evaluation. Negative values - decline in abundance; positive values - increase in abundance; zero - no change in abundance.
| 80 to 100 | 50 | 20 to 30 | No Change | 30- to 20- | 50- | 100- to 80- | Data Missing |
|---|---|---|---|---|---|---|---|
| 0 | 4 | 2 | 22 | 12 | 14 | 11 | 16 |
| Rarity | |
|---|---|
| Vulnerability | |
| Attractiveness | |
| Endemism | |
| Red number | |
| Peripherality | |
| IUCN category | |
| Threat Definition according to the red book |


