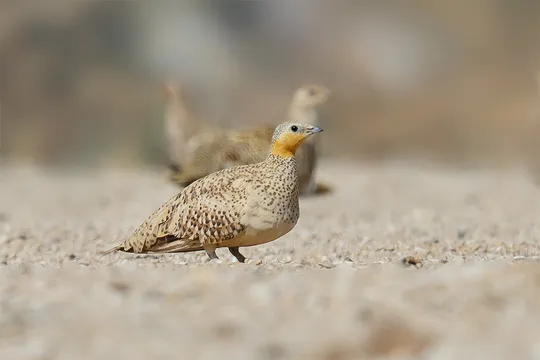
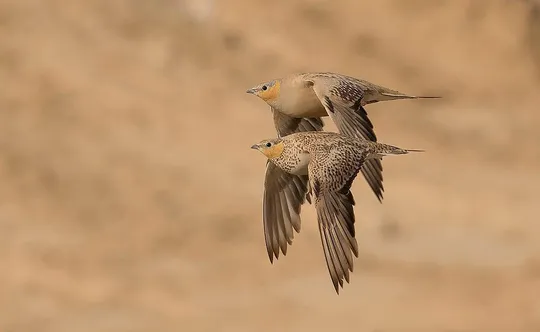
Pterocles senegallus
 Endangered
 Contributed:
| Habitats | Desert Plains, Inland Sand Dunes |
|---|---|
| Presence In Israel | Resident |
| Breeding In Israel | Breeder |
| Migration Types | Resident, Nomad |
| Zoographical Zones | Saharo-Arabian |
| Landscape Types | Plains & Valleys, Wide Wadis, Sand Dunes |
| Vegetation Densities | Low |
| Nest Locations | Ground |
| Diet Types | Herbivore |
| Foraging Grounds | Ground |
| Body Sizes | Small (up to 500g) |
| Threat Factors | Overgrazing, Habitat loss and fragmentation, Direct disturbance from human activity, Increased predation from invasive and eruptive species |
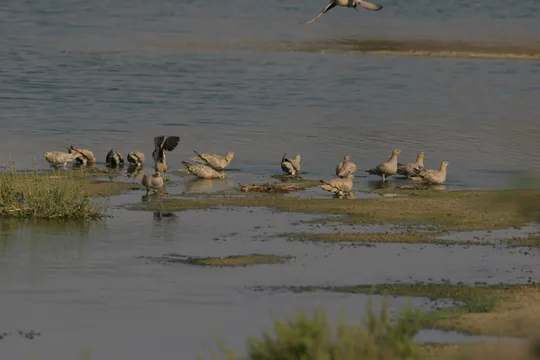
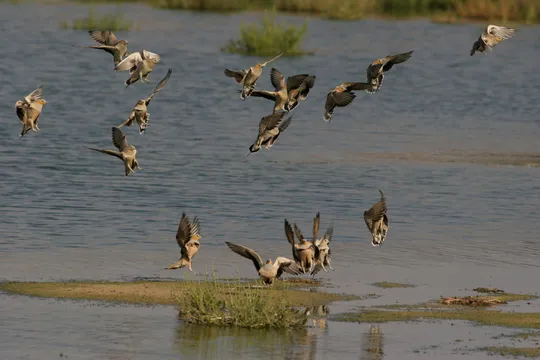
The Spotted Sandgrouse is a relatively common resident species in the Negev and the Arava Valley. Its range in the Western Negev extends from the Tlalim-Tse’elim line and south, and in the Eastern Negev, from the Hatseva-Dimona line to the Uvda Valley. The species was once more common throughout its current range as well as northwards, in the Judean Desert Plateau and the Be’er Sheva Valley. In the 1980s, its population was estimated at 10,000-15,000 birds that gathered at drinking points, of which 2,000-3,000 were breeding pairs (Shirihai 1996). From 1985 the number of sandgrouse at drinking spots in the Nitsana-Shivta area decreased to between tens and a few hundred individuals. During the 1990s, the Spotted Sandgrouse receded from the Be’er Sheva Valley and the northwestern Negev, and from the Judean Desert Plateau. The southern Negev population, which number a few hundred birds, has remained stable over the years, but information from this area is inadequate.
Open habitats with low sparse vegetation, such as the loess and sand plains, low hills, broad wadis and hamada flats in the desert region. Outside the breeding season, Spotted Sandgrouse may concentrate in small flocks in cultivated fields and green patches in the desert. As other sandgrouse species, its activity is associated with permanent water sources.
Direct disturbance, mainly by military activity and grazing (particularly sheep herds accompanied by dogs).
Lack of clean drinking spots – the sandgrouse today drink mainly from sewage ponds and there is no information regarding the effect of the polluted water on their survival and reproductive capacity.
Expansion of agricultural areas – during the past two decades cultivated areas in the Northern Negev and the Arava have expanded, including extensive use of greenhouses, which reduces available habitats for the sandgrouse.
Expansion of eruptive species that are the sandgrouse’s natural enemies, such as the Red Fox, Golden Jackal, Hooded Crow and Brown-necked Raven into desert areas.
No specific conservation measures have been taken for this species to date.
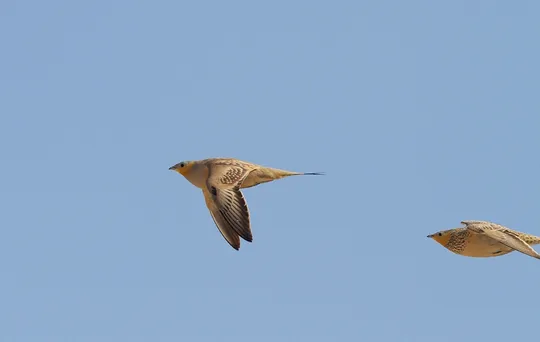
The Spotted Sandgrouse is assessed as an endangered species (EN) because of the continued decline in its population size and the reduction in its range. It is a nomadic species that wanders over extensive areas and requires permanent water sources for daily drinking. Therefore, we recommend declaring key areas for species preservation in which vehicle traffic and livestock grazing will be restricted, along with creation of permanent watering spots where the sandgrouse can drink undisturbed and not be exposed to the risk of toxins and pollution.
- פז, ע. 1986. עופות. מתוך אלון, ע. (עורך), החי והצומח של ארץ ישראל. כרך 6. הוצאת משרד הביטחון, ישראל.
- פרלמן, י., אלתרמן, ש. וגרניט, ב. 2011. סקר עופות דוגרים בנחלים הפנימיים, אביב 2011. דו"ח מרכז הצפרות של החברה להגנת הטבע.
- פרלמן, י., שוחט, א. ולבינגר, ז. 2009. סקר אטלס ציפורים בערבה סיכום שנת 2009. דו"ח מרכז הצפרות של החברה להגנת הטבע.
- צורים ע, לב ק. ( 2008 ). שינויים בתפוצת הקטות בצפון מערב הנגב בעשורים האחרונים. פוסטר. רשות הטבע . והגנים, מחוז דרום. יום המדע אפריל 2008
- שוחט א, גרניט ב. ( 2010 ). סקר קטות בנגב – קיץ 2010 . דו"ח עבור מחוז דרום של רשות הטבע והגנים.
- שוחט, א. וגרניט, ב. 2011. סיכום סקר קטות באתרי שתיה בניצנה - קיץ 2011. דו"ח רשות הטבע והגנים, החברה להגנת הטבע ומרכז דוכיפת לצפרות ואקולוגיה בירוחם.
- Perlman, Y., Shochat, E. and Labinger, Z. 2011. Developing Managment plan for important bird areas in southern Israel. second annual report, Nizzana region and Arava Valley.Israeli Ornithological center, SPNI.
- Shirihai, H., 1996. The Birds of Israel. Academic Press, London.
- Symes, A. 2013. Species generation lengths. Unpublished, BirdLife International.
- Species page at Birdlife International
Contributed:
Current Occupancy Map
| Data Missing | Sporadic | Limited Sites | Low Density | High Density |
|---|---|---|---|---|
| 0 | 0 | 0 | 0 | 0 |
Distribution maps
The maps presented here provide visual information on the distribution of species in Israel from the past and present, and the changes in occupancy and breeding density during the comparison period. For further reading
Relative Abundance 2010-2020
Breeding density values in the current decade as determined from experts' opinion and observations from databases.
| Data Missing | Sporadic | Limited Sites | Low Density | High Density |
|---|---|---|---|---|
| 8 | 12 | 12 | 21 | 19 |
Relative Abundance 1980-1990
Density values based primarily on the book The Birds of Israel (Shirihai 1996).
| Data Missing | Sporadic | Limited Sites | Low Density | High Density |
|---|---|---|---|---|
| 5 | 14 | 14 | 17 | 22 |
Occupancy 1990-2020
The map shows differences in the species breeding distribution between the 1980's breeding map and the current weighted breeding evaluation. Negative value - species previously bred in the grid and is not presently breeding; positive value - species has not previously bred in the grid and is currently breeding.
| Data Missing | No Change | Occupancy Increase | Occupancy Decrease |
|---|---|---|---|
| 6 | 35 | 1 | 9 |
Change in Relative Abundance 1990-2020
The map shows the changes in the relative abundance of a species in each of the distribution grids between the breeding map of the 1980s and the weighted current breeding evaluation. Negative values - decline in abundance; positive values - increase in abundance; zero - no change in abundance.
| 80 to 100 | 50 | 20 to 30 | No Change | 30- to 20- | 50- | 100- to 80- | Data Missing |
|---|---|---|---|---|---|---|---|
| 0 | 4 | 2 | 22 | 12 | 14 | 11 | 16 |
| Rarity | |
|---|---|
| Vulnerability | |
| Attractiveness | |
| Endemism | |
| Red number | |
| Peripherality | |
| IUCN category | |
| Threat Definition according to the red book |


