Alaemon alaudipes
 Critically Endangered
 Contributed:
| Habitats | Desert Plains, Inland Sand Dunes |
|---|---|
| Presence In Israel | Resident |
| Breeding In Israel | Breeder |
| Migration Types | Nomad |
| Zoographical Zones | Saharo-Arabian, Sudani |
| Landscape Types | Wide Wadis, Sand Dunes |
| Vegetation Densities | Low |
| Nest Locations | Ground |
| Diet Types | Invertebrate, Herbivore |
| Foraging Grounds | Ground |
| Body Sizes | Small (up to 500g) |
| Threat Factors | Habitat loss and fragmentation |
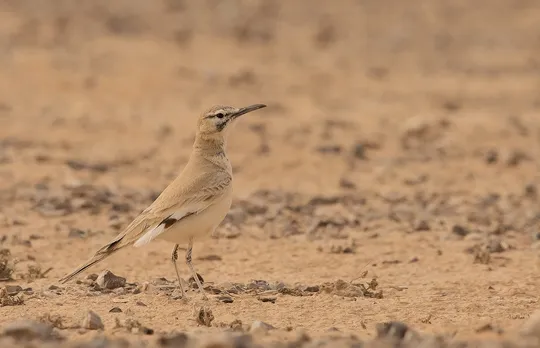
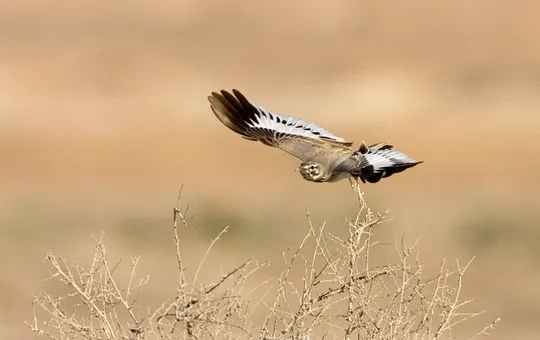
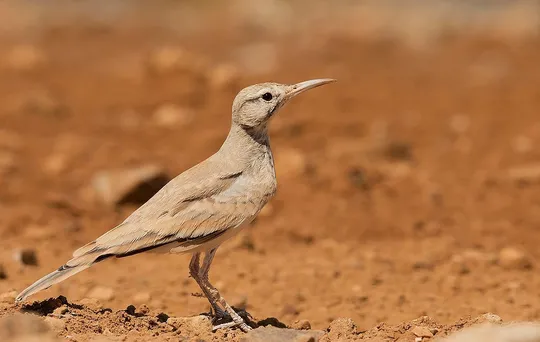
The Greater Hoopoe-lark inhabits desert flatlands. It has a sandy brown plumage that provides excellent camouflage on the ground, but when it flies, it reveals a black and white wing pattern visible from a distance. It has a long, curved bill and a distinct melodious song that the male makes perched on a top of a shrub or during its mating flight.
A rare breeder in the southern Arava Valley and the southern Negev flatlands. It is nomadic and the number of breeding pairs varies from year to year. In the 1980s, the population was estimated at about 150 pairs in the Arava, the Eastern Negev and the Western Negev in the Nitsana-Shivta area (Shirihai 1996). At present there are apparently no more than 15 pairs remaining that nest in the remote areas of the southern Negev and Arava (Perlman et. al. 2012). There are also records of nesting in the Western Negev Sands, after an absence of some two decades (Nir Sapir, Eyal Shochat & Barak Granit 2017).
Open sandy and loess landscapes or rocky flatlands with low, sparse vegetation.
The Greater Hoopoe-lark has a Saharo-Sindian distribution, from Western Africa (including an isolated population on the Cabo Verde Archipelago), the Sahara, the Middle East, the Arabian Penisnsula, Pakistan and the Thar Desert in northern India.
The Greater Hoopoe-lark has been adversely affected by the rapid development in the Arava Valley during the past two decades, including expansion of settlements, roadbuilding and conversion of natural areas, particularly sand dunes to date palm groves and other agricultural crops. Previously unknown nesting areas have been discovered in recent years, in inland wadis, mostly in IDF military areas that are not official nature reserves and lack statutory protection.
No specific conservation measures have been taken for this species to date.
The Greater Hoopoe-lark is a nomadic lark species that inhabits open habitats in the extreme desert. The size of the breeding population varies greatly from year to year, and the breeding population in Israel today is relictual and fragmented due to the decrease in suitable habitats. The species has almost completely disappeared from the Arava and the Western Negev sands, which were once the core of its range. In the Jordanian Arava Valley and in Northern Sinai there are apparently larger breeding populations that could be the base for movement of individuals to Israel (“rescue effect”). The areas where the species nests regularly, particularly in the inland wadis should be preserved.
We recommend protecting key areas in the Arava, such as the Samar sands against future development and affording statutory protection for nesting sites in the inland wadis (e.g. declaring them nature reserves).
- פז, ע. 1986. עופות. מתוך אלון, ע. (עורך), החי והצומח של ארץ ישראל. כרך 6. הוצאת משרד הביטחון, ישראל.
- פרלמן, י., אלתרמן, ש. וגרניט, ב. 2011. סקר עופות דוגרים בנחלים הפנימיים, אביב 2011. דו"ח מרכז הצפרות של החברה להגנת הטבע.
- פרלמן, י., שוחט, א. ולבינגר, ז. 2009. סקר אטלס ציפורים בערבה סיכום שנת 2009. דו"ח מרכז הצפרות של החברה להגנת הטבע.
- Perlman, Y., Shochat, E. and Labinger, Z. 2011. Developing Managment plan for important bird areas in southern Israel. second annual report, Nizzana region and Arava Valley.Israeli Ornithological center, SPNI.
- Shirihai, H., 1996. The Birds of Israel. Academic Press, London.
- Symes, A. 2013. Species generation lengths. Unpublished, BirdLife International.
- Species page at Birdlife International
Contributed:
Current Occupancy Map
| Data Missing | Sporadic | Limited Sites | Low Density | High Density |
|---|---|---|---|---|
| 0 | 0 | 0 | 0 | 0 |
Distribution maps
The maps presented here provide visual information on the distribution of species in Israel from the past and present, and the changes in occupancy and breeding density during the comparison period. For further reading
Relative Abundance 2010-2020
Breeding density values in the current decade as determined from experts' opinion and observations from databases.
| Data Missing | Sporadic | Limited Sites | Low Density | High Density |
|---|---|---|---|---|
| 8 | 12 | 12 | 21 | 19 |
Relative Abundance 1980-1990
Density values based primarily on the book The Birds of Israel (Shirihai 1996).
| Data Missing | Sporadic | Limited Sites | Low Density | High Density |
|---|---|---|---|---|
| 5 | 14 | 14 | 17 | 22 |
Occupancy 1990-2020
The map shows differences in the species breeding distribution between the 1980's breeding map and the current weighted breeding evaluation. Negative value - species previously bred in the grid and is not presently breeding; positive value - species has not previously bred in the grid and is currently breeding.
| Data Missing | No Change | Occupancy Increase | Occupancy Decrease |
|---|---|---|---|
| 6 | 35 | 1 | 9 |
Change in Relative Abundance 1990-2020
The map shows the changes in the relative abundance of a species in each of the distribution grids between the breeding map of the 1980s and the weighted current breeding evaluation. Negative values - decline in abundance; positive values - increase in abundance; zero - no change in abundance.
| 80 to 100 | 50 | 20 to 30 | No Change | 30- to 20- | 50- | 100- to 80- | Data Missing |
|---|---|---|---|---|---|---|---|
| 0 | 4 | 2 | 22 | 12 | 14 | 11 | 16 |
| Rarity | |
|---|---|
| Vulnerability | |
| Attractiveness | |
| Endemism | |
| Red number | |
| Peripherality | |
| IUCN category | |
| Threat Definition according to the red book |


