Caprimulgus aegyptius
 Critically Endangered
 Contributed:
| Habitats | Desert Plains, Salt Marsh, Inland Sand Dunes |
|---|---|
| Presence In Israel | Summer |
| Breeding In Israel | Breeder |
| Migration Types | Short Range / Partial |
| Zoographical Zones | Sudani |
| Landscape Types | Plains & Valleys, Sand Dunes |
| Vegetation Densities | Low |
| Nest Locations | Ground |
| Diet Types | Invertebrate |
| Foraging Grounds | Aerial |
| Body Sizes | Small (up to 500g) |
| Threat Factors | Pesticide Poisoning, Habitat loss and fragmentation |
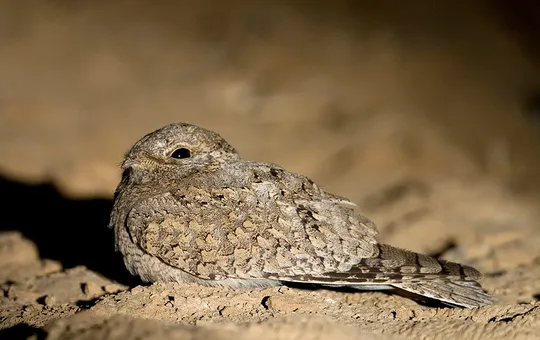
The Egyptian Nightjar has a sandy-colored, rather uniform plumage. It inhabits desert areas and is active at night, spending the day resting in the shade of a shrub or a fold in the ground. A relatively low-flying bird, occasionally jerking sharply to catch flying insects. It is quiet during most of the year, only sounding its high-pitched, chain-saw like song during the nesting season.
The Egyptian Nightjar is a very rare resident breeder in the southern Jordan Valley, and possibly in the northern Arava as well. Small numbers also pass over in autumn and spring migration, principally in the southern Negev and the Arava. Up to the mid-20th century, its breeding area was more extensive, and included the Coastal Plain. The last evidence of which was a chick collected near Pardes Hanna in 1947 (Merom 1960, Paz 1986, Shirihai 1996). Breeding in the Mediterranean area of Israel ceased by the 1960s , probably due to the extensive development of this entire region, as well as insecticide use in agriculture. Evidence of nesting in the desert region was recorded in the northern Arava in 1992 (Adi Ganz et al, pers. comm.), in the Sodom Basin in spring 2012 (Yoav Perlman, pers. comm.) and in 2016-2017 the species was found nesting in small numbers in sandy areas in the northern Dead Sea (Adi Ganz, Amir Ben Dov, unpublished data). The population in this area is apparently stable and comprises several tens of birds (a maximum of 20 individuals seen at a single observation).
The Egyptian Nightjar’s breeding and foraging areas in the southern Jordan Valley are threatened by development for military and agricultural uses.
No specific conservation measures have been taken for this species to date.
The Egyptian Nightjar has only recently been identified as a breeding species in Israel, after it was considered extinct for tens of years. The study of the breeding population is still in its early stages; however it seems that the population is very small and limited to specific habitats, some of which are in immediate danger of development.
- פז, ע. 1986. עופות. מתוך אלון, ע. (עורך), החי והצומח של ארץ ישראל. כרך 6. הוצאת משרד הביטחון, ישראל.
- Shirihai, H., 1996. The Birds of Israel. Academic Press, London.
- Symes, A. 2013. Species generation lengths. Unpublished, BirdLife International.
- Species page at Birdlife International
Contributed:
Current Occupancy Map
| Data Missing | Sporadic | Limited Sites | Low Density | High Density |
|---|---|---|---|---|
| 0 | 0 | 0 | 0 | 0 |
Distribution maps
The maps presented here provide visual information on the distribution of species in Israel from the past and present, and the changes in occupancy and breeding density during the comparison period. For further reading
Relative Abundance 2010-2020
Breeding density values in the current decade as determined from experts' opinion and observations from databases.
| Data Missing | Sporadic | Limited Sites | Low Density | High Density |
|---|---|---|---|---|
| 8 | 12 | 12 | 21 | 19 |
Relative Abundance 1980-1990
Density values based primarily on the book The Birds of Israel (Shirihai 1996).
| Data Missing | Sporadic | Limited Sites | Low Density | High Density |
|---|---|---|---|---|
| 5 | 14 | 14 | 17 | 22 |
Occupancy 1990-2020
The map shows differences in the species breeding distribution between the 1980's breeding map and the current weighted breeding evaluation. Negative value - species previously bred in the grid and is not presently breeding; positive value - species has not previously bred in the grid and is currently breeding.
| Data Missing | No Change | Occupancy Increase | Occupancy Decrease |
|---|---|---|---|
| 6 | 35 | 1 | 9 |
Change in Relative Abundance 1990-2020
The map shows the changes in the relative abundance of a species in each of the distribution grids between the breeding map of the 1980s and the weighted current breeding evaluation. Negative values - decline in abundance; positive values - increase in abundance; zero - no change in abundance.
| 80 to 100 | 50 | 20 to 30 | No Change | 30- to 20- | 50- | 100- to 80- | Data Missing |
|---|---|---|---|---|---|---|---|
| 0 | 4 | 2 | 22 | 12 | 14 | 11 | 16 |
| Rarity | |
|---|---|
| Vulnerability | |
| Attractiveness | |
| Endemism | |
| Red number | |
| Peripherality | |
| IUCN category | |
| Threat Definition according to the red book |


