Caprimulgus nubicus
 Vulnerable
 Contributed:
| Habitats | Desert Plains, Salt Marsh |
|---|---|
| Presence In Israel | Resident |
| Breeding In Israel | Breeder |
| Migration Types | Short Range / Partial |
| Zoographical Zones | Sudani |
| Landscape Types | Plains & Valleys, Salt Marsh |
| Vegetation Densities | Medium |
| Nest Locations | Ground |
| Diet Types | Invertebrate |
| Foraging Grounds | Aerial |
| Body Sizes | Small (up to 500g) |
| Threat Factors | Pesticide Poisoning, Habitat loss and fragmentation, Nest destruction by agricultural activity |
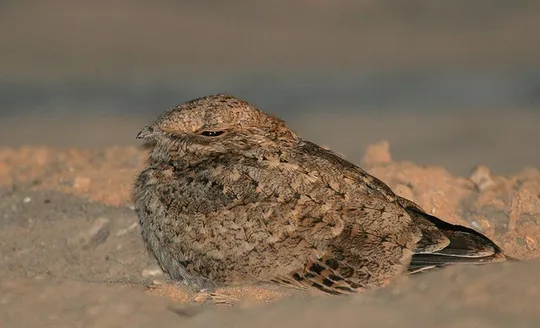
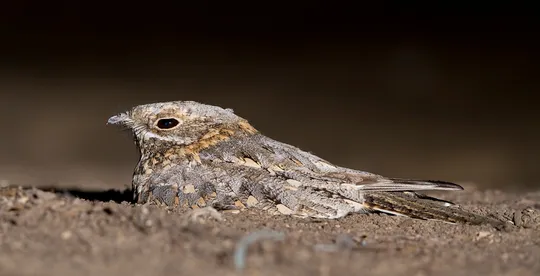
The Nubian Nightjar has a pale rusty brown plumage, with white spots on its wings and on the tips of its tail, which are visible in flight. The sexes are similar. The male song sounds like a distant dog bark and can be heard in spring and summer. It feeds mostly on moths that it locates from the ground, using mainly its sight, and therefore is more active at dawn and dusk and on nights with strong moonlight.
The Nubian Nightjar is a rare resident and summer breeding species at the northern Arava and in the Dead Sea area. Its population is estimated at 60-70 pairs in the Sodom Basin, 10-20 pairs in the northern Arava, 5-10 pairs in the northern Dead Sea and a few pairs in the southern Arava (Haviv & Perlman 2016, Moran Bakish pers. comm., Noam Weiss pers. comm.), with a total of 75-100 pairs. Until the early 1980s, it was a relatively common breeder in extensive areas in the Arava and Dead Sea valleys, as well as in the Jordan Valley north up to Bet She’an. The drastic reduction in the number of individuals and in its range was recorded during the 1980s. At the end of the decade, the species population was assessed at 15-20 pairs in the Arava and a few pairs in the Jordan and Bet She’an valleys (Shirihai 1996).
Salt marshes with scattered tamarisk trees, rocky flats and sand dunes with sparse vegetation in desert Sudanian climate.
Habitat destruction – mainly expansion of cultivated areas at the expense of salt marshes.
Poisoning – the species was apparently affected by insecticides.
Roadkill – the species is very susceptible to roadkill because of its tendency to freeze on the spot when it is blinded by vehicle headlights and low-flying hunting behavior.
Direct disturbance – mainly by off-road vehicles.
No specific conservation measures have been taken for this species to date.
The core areas in which there is relatively dense Nubian Nightjar nesting should be preserved and receive statutory protection.
- חביב, א. ופרלמן, י. 2016. סיכום ניטור תחמס נובי (Caprimulgus nubicus) במלחת סדום, קיץ 2015. דו"ח מרכז הצפרות של החברה להגנת הטבע.
- פז, ע. 1986. עופות. מתוך אלון, ע. (עורך), החי והצומח של ארץ ישראל. כרך 6. הוצאת משרד הביטחון, ישראל.
- פרלמן, י. 2005. על מצבו של התחמס הנובי בישראל. העזניה 33, הוצאת טבע הדברים והחברה להגנת הטבע.
- פרלמן, י., שוחט, א. ולבינגר, ז. 2009. סקר אטלס ציפורים בערבה סיכום שנת 2009. דו"ח מרכז הצפרות של החברה להגנת הטבע.
- Shirihai, H., 1996. The Birds of Israel. Academic Press, London.
- Symes, A. 2013. Species generation lengths. Unpublished, BirdLife International.
- Species page at Birdlife International
Contributed:
Current Occupancy Map
| Data Missing | Sporadic | Limited Sites | Low Density | High Density |
|---|---|---|---|---|
| 0 | 0 | 0 | 0 | 0 |
Distribution maps
The maps presented here provide visual information on the distribution of species in Israel from the past and present, and the changes in occupancy and breeding density during the comparison period. For further reading
Relative Abundance 2010-2020
Breeding density values in the current decade as determined from experts' opinion and observations from databases.
| Data Missing | Sporadic | Limited Sites | Low Density | High Density |
|---|---|---|---|---|
| 8 | 12 | 12 | 21 | 19 |
Relative Abundance 1980-1990
Density values based primarily on the book The Birds of Israel (Shirihai 1996).
| Data Missing | Sporadic | Limited Sites | Low Density | High Density |
|---|---|---|---|---|
| 5 | 14 | 14 | 17 | 22 |
Occupancy 1990-2020
The map shows differences in the species breeding distribution between the 1980's breeding map and the current weighted breeding evaluation. Negative value - species previously bred in the grid and is not presently breeding; positive value - species has not previously bred in the grid and is currently breeding.
| Data Missing | No Change | Occupancy Increase | Occupancy Decrease |
|---|---|---|---|
| 6 | 35 | 1 | 9 |
Change in Relative Abundance 1990-2020
The map shows the changes in the relative abundance of a species in each of the distribution grids between the breeding map of the 1980s and the weighted current breeding evaluation. Negative values - decline in abundance; positive values - increase in abundance; zero - no change in abundance.
| 80 to 100 | 50 | 20 to 30 | No Change | 30- to 20- | 50- | 100- to 80- | Data Missing |
|---|---|---|---|---|---|---|---|
| 0 | 4 | 2 | 22 | 12 | 14 | 11 | 16 |
| Rarity | |
|---|---|
| Vulnerability | |
| Attractiveness | |
| Endemism | |
| Red number | |
| Peripherality | |
| IUCN category | |
| Threat Definition according to the red book |


