Cercotrichas galactotes
 Vulnerable
 Contributed:
| Habitats | Mediterranean Batha, Parks & Woodlands, Planted Forest, Bush & Garrigue |
|---|---|
| Presence In Israel | Migrant, Summer |
| Breeding In Israel | Breeder |
| Migration Types | Long Range |
| Zoographical Zones | Mediterranean, Irano-Turanian |
| Landscape Types | Plains & Valleys, Wide Wadis, Rural Area |
| Vegetation Types | Mediterranean Maquis, Mediterranean Garrigue, Steppe, Plantation, Parks |
| Vegetation Densities | Medium, Low |
| Nest Locations | Tree, Bushes |
| Diet Types | Invertebrate |
| Foraging Grounds | Ground, Trees and Shrubs |
| Body Sizes | Small (up to 500g) |
| Threat Factors | Pesticide Poisoning, Habitat loss and fragmentation, Aforestation, Tree planting |
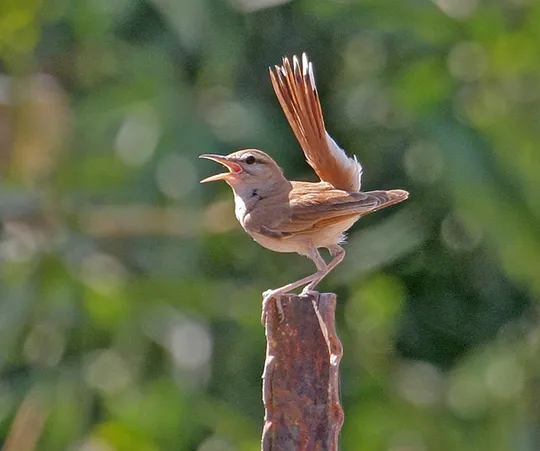
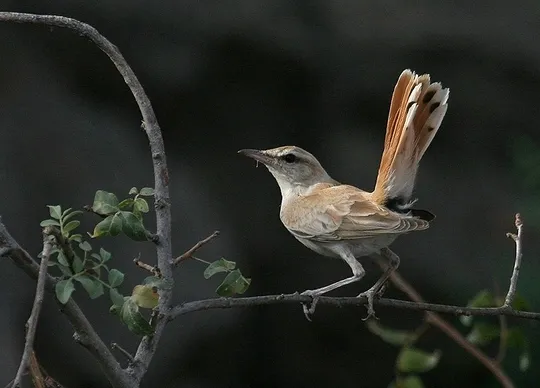
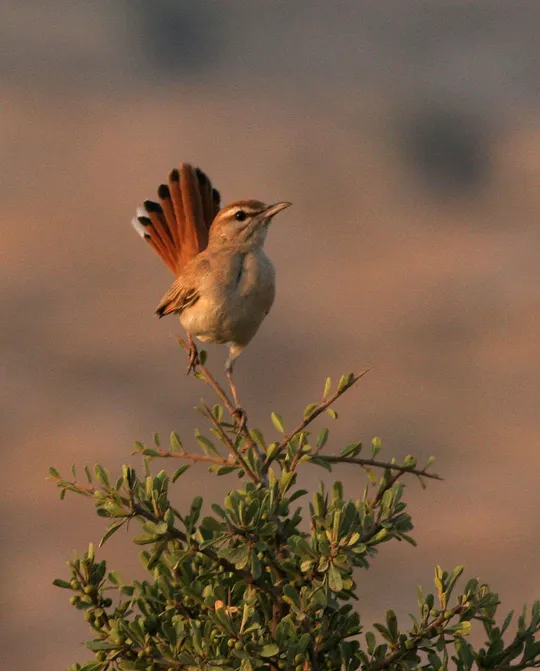
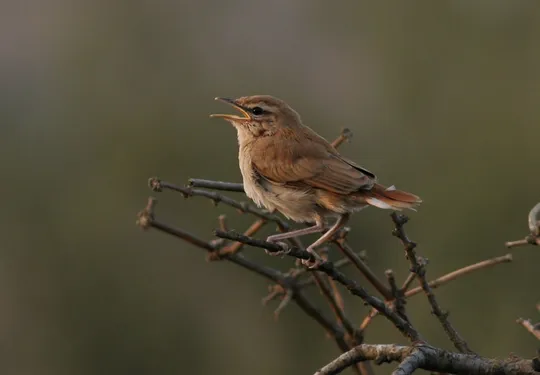
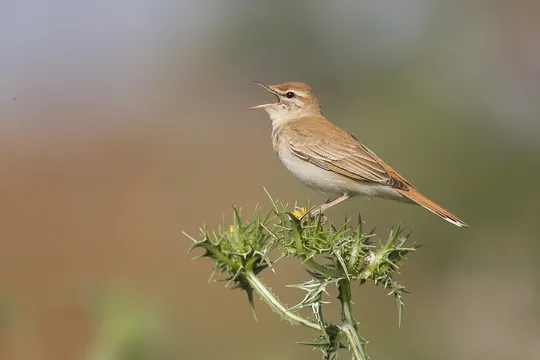
The Rufous-tailed Scrub Robin is a medium-sized insect-eating bird, resembling a nightingale in its shape, long legs and habit to hop on the ground and extend its tail upwards. Its head and upperparts are rufous brown, white belly, and tail rufous tipped with black and white spots that are revealed when the tail is fanned. The head pattern is prominent, with a dark eye stripe and a pale supercilium. It is very noisy in the mating season and can be recognized by its rufous tail, which it spreads and bobs up and down.
Breeds in partially open landscapes with scattered trees and shrubs, in both natural and cultivated areas. It prefers rather dry areas, with sparse groves or orchards, shrubs and hedges, sometimes near human habitations.
No specific conservation measures have been taken for this species to date.
- חביב, א. ומירוז, א. 2017. סיכום סקר עופות בערבות הירדן. דו"ח רשות הטבע והגנים והחברה להגנת הטבע.
- מירוז, א. 2013. סיכום סקר ציפורים במזרח לכיש, אביב 2013. דו"ח רשות הטבע והגנים.
- מירוז, א. ושוחט, א. 2014. סיכום סקר ציפורים סביב היישוב נטע במזרח לכיש – 2014. דו"ח רשות הטבע והגנים.
- מירוז, א., 2007 . סיכום סקר ציפורים בגבעות גומר. דו"ח עבור רשות הטבע והגנים.
- פז, ע. 1986. עופות. מתוך אלון, ע. (עורך), החי והצומח של ארץ ישראל. כרך 6. הוצאת משרד הביטחון, ישראל.
- פרלמן, י., שוחט, א. ולבינגר, ז. 2009. סקר אטלס ציפורים בערבה סיכום שנת 2009. דו"ח מרכז הצפרות של החברה להגנת הטבע.
- Shirihai, H., 1996. The Birds of Israel. Academic Press, London.
- Symes, A. 2013. Species generation lengths. Unpublished, BirdLife International.
- Species page at Birdlife International
Contributed:
Current Occupancy Map
| Data Missing | Sporadic | Limited Sites | Low Density | High Density |
|---|---|---|---|---|
| 0 | 0 | 0 | 0 | 0 |
Distribution maps
The maps presented here provide visual information on the distribution of species in Israel from the past and present, and the changes in occupancy and breeding density during the comparison period. For further reading
Relative Abundance 2010-2020
Breeding density values in the current decade as determined from experts' opinion and observations from databases.
| Data Missing | Sporadic | Limited Sites | Low Density | High Density |
|---|---|---|---|---|
| 8 | 12 | 12 | 21 | 19 |
Relative Abundance 1980-1990
Density values based primarily on the book The Birds of Israel (Shirihai 1996).
| Data Missing | Sporadic | Limited Sites | Low Density | High Density |
|---|---|---|---|---|
| 5 | 14 | 14 | 17 | 22 |
Occupancy 1990-2020
The map shows differences in the species breeding distribution between the 1980's breeding map and the current weighted breeding evaluation. Negative value - species previously bred in the grid and is not presently breeding; positive value - species has not previously bred in the grid and is currently breeding.
| Data Missing | No Change | Occupancy Increase | Occupancy Decrease |
|---|---|---|---|
| 6 | 35 | 1 | 9 |
Change in Relative Abundance 1990-2020
The map shows the changes in the relative abundance of a species in each of the distribution grids between the breeding map of the 1980s and the weighted current breeding evaluation. Negative values - decline in abundance; positive values - increase in abundance; zero - no change in abundance.
| 80 to 100 | 50 | 20 to 30 | No Change | 30- to 20- | 50- | 100- to 80- | Data Missing |
|---|---|---|---|---|---|---|---|
| 0 | 4 | 2 | 22 | 12 | 14 | 11 | 16 |
| Rarity | |
|---|---|
| Vulnerability | |
| Attractiveness | |
| Endemism | |
| Red number | |
| Peripherality | |
| IUCN category | |
| Threat Definition according to the red book |


