Oenanthe finschii
 Vulnerable
 Contributed:
| Habitats | Rocky Terrain, Alpine Scrubland |
|---|---|
| Presence In Israel | Winter Visitor, Summer |
| Breeding In Israel | Breeder |
| Migration Types | Short Range / Partial |
| Zoographical Zones | Alpine |
| Landscape Types | Mountainous, Rugged Terrain |
| Vegetation Types | Mediterranean Garrigue, Steppe |
| Vegetation Densities | Low |
| Nest Locations | Ground |
| Diet Types | Invertebrate |
| Foraging Grounds | Ground |
| Body Sizes | Small (up to 500g) |
| Threat Factors | Habitat loss and fragmentation |
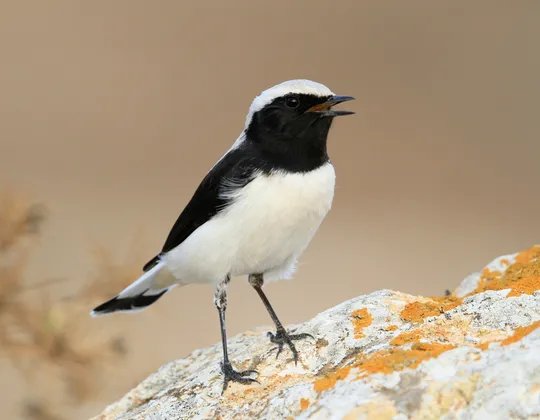
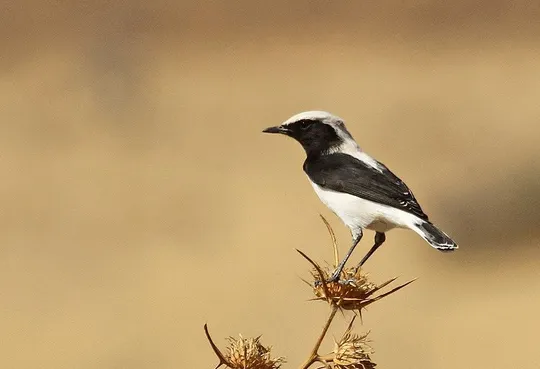
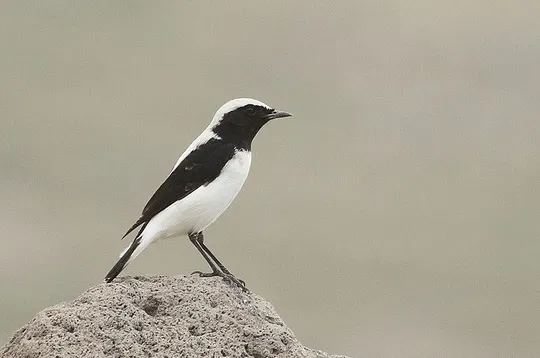
Finsch’s Wheatear is a medium-sized, prominently sexually dimorphic wheatear. The males have a distinct black and white plumage, with almost no grey or brown. The female has brown-grey upperparts, a grey breast and occasionally a blackish throat, reminiscent of the male plumage.
A relatively common winter visitor in the Golan Heights, the Eastern Galilee, the Judean and Samarian mountains and the Northern Negev shrublands. It is an extremely rare breeder on the upper Mt. Hermon. Only 1-2 pairs were recorded in surveys conducted on Mt. Hermon in 2013 and 2014, at an altitude of 1,300 meters.
Finsch’s Wheatear nests on rocky mountain slopes. It winters in shrubland and in rocky or semi-exposed areas on mountain slopes or in desert transition area.
Finsch’s Wheatear is threatened by development work on Mt. Hermon, including roadworks, development of ski runs and other installations.
No specific conservation measures have been taken for this species to date.
Development work on Mt. Hermon should be kept to a minimum and supervised to minimize damage to natural habitats.
- ישראלי, נ. ופרלמן, י. 2013. סיכום סקר עופות מקננים בחרמון. דו"ח מרכז הצפרות של החברה להגנת הטבע.
- פז, ע. 1986. עופות. מתוך אלון, ע. (עורך), החי והצומח של ארץ ישראל. כרך 6. הוצאת משרד הביטחון, ישראל.
- Shirihai, H., 1996. The Birds of Israel. Academic Press, London.
- Symes, A. 2013. Species generation lengths. Unpublished, BirdLife International.
- Species page at Birdlife International
Contributed:
Current Occupancy Map
| Data Missing | Sporadic | Limited Sites | Low Density | High Density |
|---|---|---|---|---|
| 0 | 0 | 0 | 0 | 0 |
Distribution maps
The maps presented here provide visual information on the distribution of species in Israel from the past and present, and the changes in occupancy and breeding density during the comparison period. For further reading
Relative Abundance 2010-2020
Breeding density values in the current decade as determined from experts' opinion and observations from databases.
| Data Missing | Sporadic | Limited Sites | Low Density | High Density |
|---|---|---|---|---|
| 8 | 12 | 12 | 21 | 19 |
Relative Abundance 1980-1990
Density values based primarily on the book The Birds of Israel (Shirihai 1996).
| Data Missing | Sporadic | Limited Sites | Low Density | High Density |
|---|---|---|---|---|
| 5 | 14 | 14 | 17 | 22 |
Occupancy 1990-2020
The map shows differences in the species breeding distribution between the 1980's breeding map and the current weighted breeding evaluation. Negative value - species previously bred in the grid and is not presently breeding; positive value - species has not previously bred in the grid and is currently breeding.
| Data Missing | No Change | Occupancy Increase | Occupancy Decrease |
|---|---|---|---|
| 6 | 35 | 1 | 9 |
Change in Relative Abundance 1990-2020
The map shows the changes in the relative abundance of a species in each of the distribution grids between the breeding map of the 1980s and the weighted current breeding evaluation. Negative values - decline in abundance; positive values - increase in abundance; zero - no change in abundance.
| 80 to 100 | 50 | 20 to 30 | No Change | 30- to 20- | 50- | 100- to 80- | Data Missing |
|---|---|---|---|---|---|---|---|
| 0 | 4 | 2 | 22 | 12 | 14 | 11 | 16 |
| Rarity | |
|---|---|
| Vulnerability | |
| Attractiveness | |
| Endemism | |
| Red number | |
| Peripherality | |
| IUCN category | |
| Threat Definition according to the red book |


