Oenanthe isabellina
 Vulnerable

 Contributed:
| Habitats | Semi-desert Batha, Desert Plains, Loess Ravines, Inland Sand Dunes |
|---|---|
| Presence In Israel | Summer, Migrant, Resident |
| Breeding In Israel | Breeder |
| Migration Types | Short Range / Partial |
| Zoographical Zones | Irano-Turanian, Saharo-Arabian |
| Landscape Types | Plains & Valleys, Wide Wadis |
| Vegetation Types | Steppe, Herbaceous |
| Vegetation Densities | Low |
| Nest Locations | Ground |
| Diet Types | Invertebrate |
| Foraging Grounds | Ground |
| Body Sizes | Small (up to 500g) |
| Threat Factors | Unknown, Tree planting, Habitat loss and fragmentation |
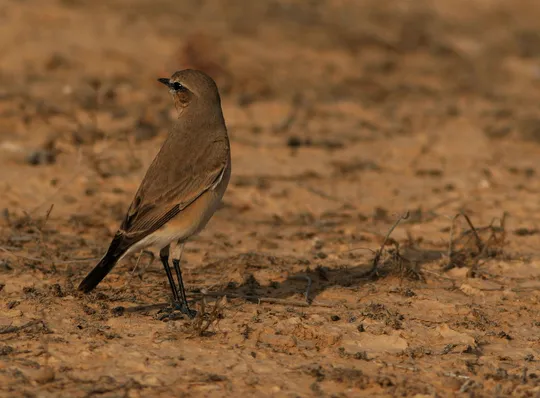
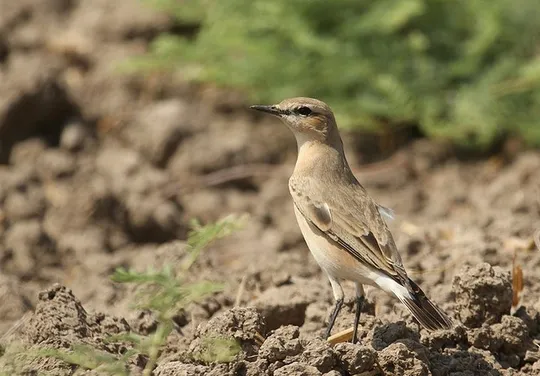
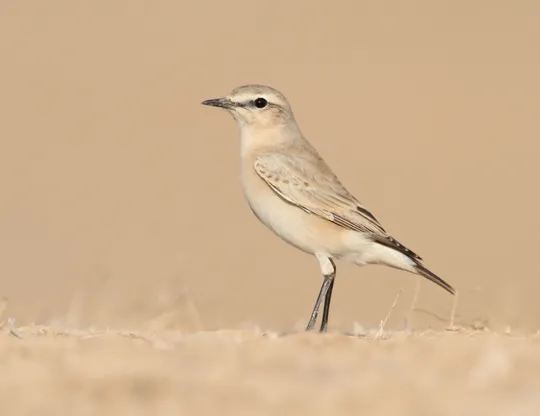
The Isabelline Wheatear is a large, upright, long-legged and long-billed wheatear. Its color is a relatively uniform sandy brown, but in flight it displays a contrasting black and white tail. Usually seen standing on low perches, and compared to other wheatears it spends a lot of time running and hopping on the ground. The male sings from the air or from the ground, and his characteristic song is a flute-like whistle interspersed with harsh rattling sounds.
Small numbers of Isabelline Wheatears summer and breed in the Western and Central Negev, and very rarely in the Jordan Valley and the Golan Heights. It winters in small numbers in the Negev, the Arava and the Jordan Valley and is a common passage migrant in autumn and spring throughout the country. Until the late 1980s, the Isabelline Wheatear was more common and nested in the Northern Negev, Judean Desert Plateau, the Jordan Valley and the Golan Heights as well. At that time, the estimated population was at least a few hundred individuals (Shirihai 1996). There is no updated assessment.
The Isabelline Wheatear nests on sandy and loess plains and on grassy steppes in the desert and steppe regions. After rain events and formation of “green patches”, it can expand its range to more extreme desert regions.
No specific conservation measures have been taken for this species to date.
- פז, ע. 1986. עופות. מתוך אלון, ע. (עורך), החי והצומח של ארץ ישראל. כרך 6. הוצאת משרד הביטחון, ישראל.
- פרלמן, י., אלתרמן, ש. וגרניט, ב. 2011. סקר עופות דוגרים בנחלים הפנימיים, אביב 2011. דו"ח מרכז הצפרות של החברה להגנת הטבע.
- Perlman, Y., Shochat, E. and Labinger, Z. 2011. Developing Managment plan for important bird areas in southern Israel. second annual report, Nizzana region and Arava Valley.Israeli Ornithological center, SPNI.
- Shirihai, H., 1996. The Birds of Israel. Academic Press, London.
- Symes, A. 2013. Species generation lengths. Unpublished, BirdLife International.
- Species page at Birdlife International
Contributed:
Current Occupancy Map
| Data Missing | Sporadic | Limited Sites | Low Density | High Density |
|---|---|---|---|---|
| 0 | 0 | 0 | 0 | 0 |
Distribution maps
The maps presented here provide visual information on the distribution of species in Israel from the past and present, and the changes in occupancy and breeding density during the comparison period. For further reading
Relative Abundance 2010-2020
Breeding density values in the current decade as determined from experts' opinion and observations from databases.
| Data Missing | Sporadic | Limited Sites | Low Density | High Density |
|---|---|---|---|---|
| 8 | 12 | 12 | 21 | 19 |
Relative Abundance 1980-1990
Density values based primarily on the book The Birds of Israel (Shirihai 1996).
| Data Missing | Sporadic | Limited Sites | Low Density | High Density |
|---|---|---|---|---|
| 5 | 14 | 14 | 17 | 22 |
Occupancy 1990-2020
The map shows differences in the species breeding distribution between the 1980's breeding map and the current weighted breeding evaluation. Negative value - species previously bred in the grid and is not presently breeding; positive value - species has not previously bred in the grid and is currently breeding.
| Data Missing | No Change | Occupancy Increase | Occupancy Decrease |
|---|---|---|---|
| 6 | 35 | 1 | 9 |
Change in Relative Abundance 1990-2020
The map shows the changes in the relative abundance of a species in each of the distribution grids between the breeding map of the 1980s and the weighted current breeding evaluation. Negative values - decline in abundance; positive values - increase in abundance; zero - no change in abundance.
| 80 to 100 | 50 | 20 to 30 | No Change | 30- to 20- | 50- | 100- to 80- | Data Missing |
|---|---|---|---|---|---|---|---|
| 0 | 4 | 2 | 22 | 12 | 14 | 11 | 16 |
| Rarity | |
|---|---|
| Vulnerability | |
| Attractiveness | |
| Endemism | |
| Red number | |
| Peripherality | |
| IUCN category | |
| Threat Definition according to the red book |


