Irania gutturalis
 Vulnerable
 Contributed:
| Presence In Israel | Summer, Migrant |
|---|---|
| Breeding In Israel | Breeder |
| Migration Types | Long Range |
| Zoographical Zones | Alpine, Irano-Turanian |
| Landscape Types | Mountainous |
| Vegetation Types | Mediterranean Maquis, Mediterranean Garrigue |
| Vegetation Densities | Medium, Low |
| Nest Locations | Bushes |
| Diet Types | Invertebrate |
| Foraging Grounds | Ground, Trees and Shrubs |
| Body Sizes | Small (up to 500g) |
| Threat Factors | Habitat loss and fragmentation |
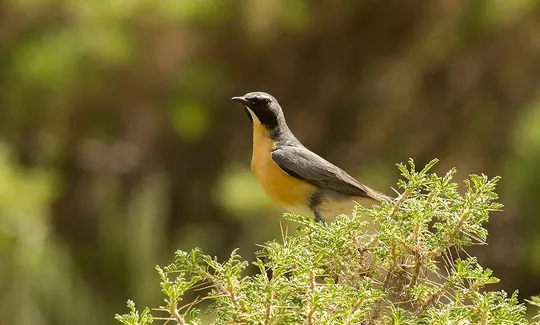
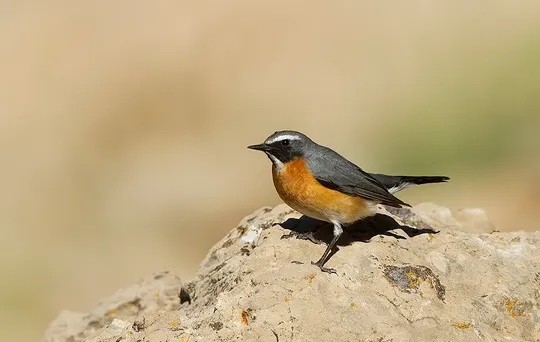
The White-throated Robin is a particularly beautiful member of the flycatcher and chat family (Muscicapidae). The male is conspicuously colorful, with an orange breast that contrasts with its white throat and black cheeks. The females and juveniles are grey and paler.
The White-throated Robin summers at Mt. Hermon, at altitudes between 1,200 and 2,000 meters. The population arrives from mid-April and leaves in July. The species nests in shrub clumps in landscapes with no or sparse tree cover. An estimated 20 pairs breed on Mt. Hermon (Israeli & Perlman 2013).
The White-throated Robin has an Irano-Turanian distribution, between Turkey in the west and Afghanistan in the east. It is not classified as globally endangered and there is no evidence of population decline (BirdLife International 2017).
The White-throated Robin is threatened by unregulated development on Mt. Hermon including roadworks, development of ski runs and other installations.
No specific conservation measures have been taken for this species to date.
Development work on Mt. Hermon should be restricted and supervised to minimize harm to natural habitats.
- ישראלי, נ. ופרלמן, י. 2013. סיכום סקר עופות מקננים בחרמון. דו"ח מרכז הצפרות של החברה להגנת הטבע.
- פז, ע. 1986. עופות. מתוך אלון, ע. (עורך), החי והצומח של ארץ ישראל. כרך 6. הוצאת משרד הביטחון, ישראל.
- שוחט, א., פרלמן, י., שני, א., עובדיה, ע., ישראלי, נ., פרלמן, ג. ואלון, ד. 2009. טיבוע ציפורים ארוך טווח בחרמון: תמורות בהרכב החברה ובדינאמיקה של אוכלוסיות.
- Shirihai, H., 1996. The Birds of Israel. Academic Press, London.
- Symes, A. 2013. Species generation lengths. Unpublished, BirdLife International.
- Species page at Birdlife International
Contributed:
Current Occupancy Map
| Data Missing | Sporadic | Limited Sites | Low Density | High Density |
|---|---|---|---|---|
| 0 | 0 | 0 | 0 | 0 |
Distribution maps
The maps presented here provide visual information on the distribution of species in Israel from the past and present, and the changes in occupancy and breeding density during the comparison period. For further reading
Relative Abundance 2010-2020
Breeding density values in the current decade as determined from experts' opinion and observations from databases.
| Data Missing | Sporadic | Limited Sites | Low Density | High Density |
|---|---|---|---|---|
| 8 | 12 | 12 | 21 | 19 |
Relative Abundance 1980-1990
Density values based primarily on the book The Birds of Israel (Shirihai 1996).
| Data Missing | Sporadic | Limited Sites | Low Density | High Density |
|---|---|---|---|---|
| 5 | 14 | 14 | 17 | 22 |
Occupancy 1990-2020
The map shows differences in the species breeding distribution between the 1980's breeding map and the current weighted breeding evaluation. Negative value - species previously bred in the grid and is not presently breeding; positive value - species has not previously bred in the grid and is currently breeding.
| Data Missing | No Change | Occupancy Increase | Occupancy Decrease |
|---|---|---|---|
| 6 | 35 | 1 | 9 |
Change in Relative Abundance 1990-2020
The map shows the changes in the relative abundance of a species in each of the distribution grids between the breeding map of the 1980s and the weighted current breeding evaluation. Negative values - decline in abundance; positive values - increase in abundance; zero - no change in abundance.
| 80 to 100 | 50 | 20 to 30 | No Change | 30- to 20- | 50- | 100- to 80- | Data Missing |
|---|---|---|---|---|---|---|---|
| 0 | 4 | 2 | 22 | 12 | 14 | 11 | 16 |
| Rarity | |
|---|---|
| Vulnerability | |
| Attractiveness | |
| Endemism | |
| Red number | |
| Peripherality | |
| IUCN category | |
| Threat Definition according to the red book |


