Pterocles alchata
 Endangered
| Habitats | Desert Plains, Inland Sand Dunes |
|---|---|
| Presence In Israel | Resident, Winter Visitor |
| Breeding In Israel | Breeder |
| Migration Types | Resident, Nomad |
| Zoographical Zones | Saharo-Arabian, Irano-Turanian |
| Landscape Types | Plains & Valleys, Wide Wadis |
| Vegetation Types | Herbaceous |
| Vegetation Densities | Low |
| Nest Locations | Ground |
| Diet Types | Herbivore |
| Foraging Grounds | Ground |
| Body Sizes | Small (up to 500g) |
| Threat Factors | Overgrazing, Habitat loss and fragmentation, Nest destruction by agricultural activity, Tree planting |
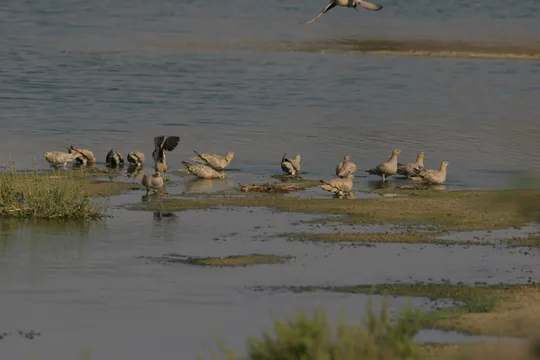
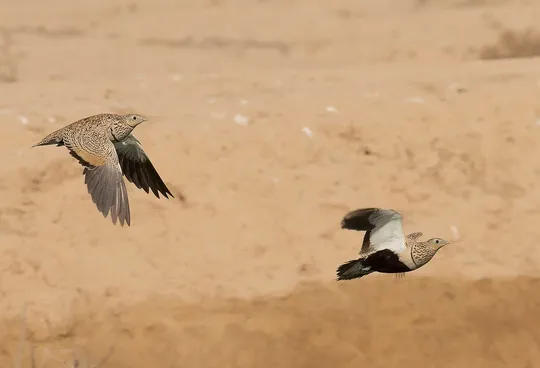
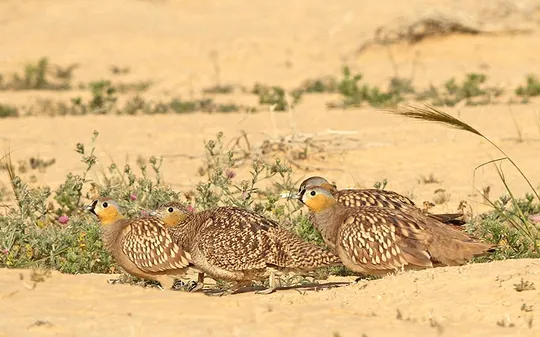
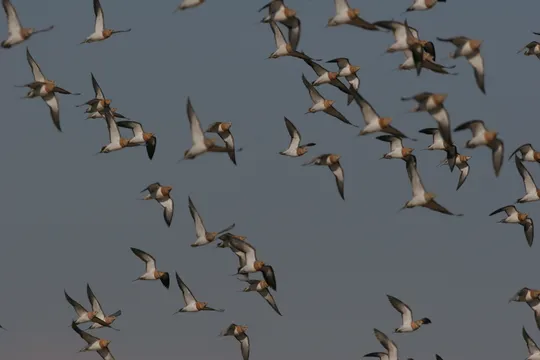
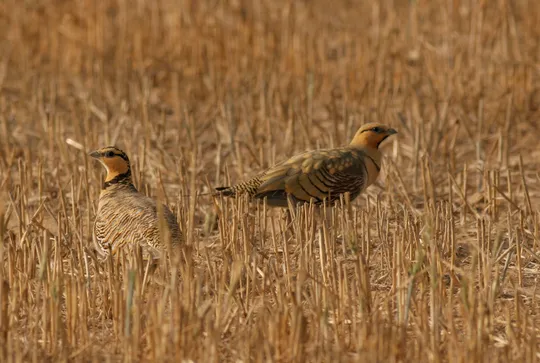
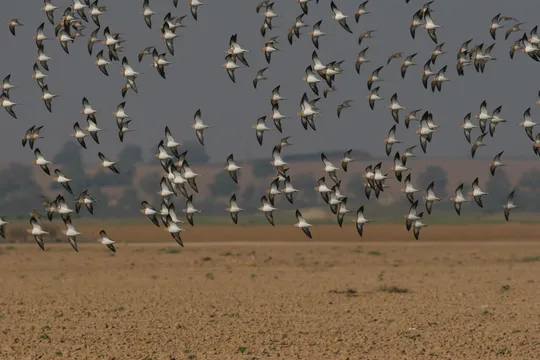
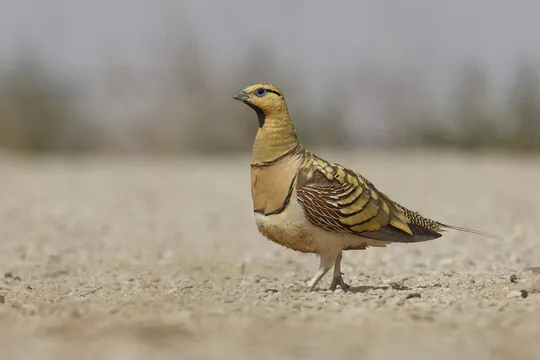
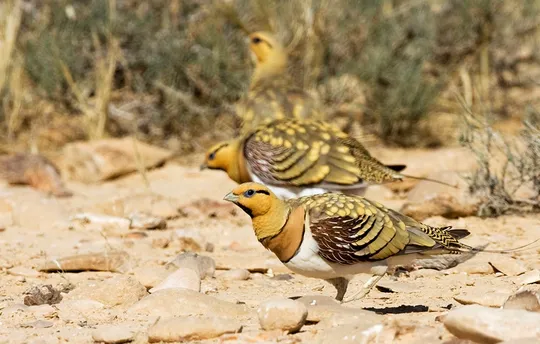
The Pin-tailed Sandgrouse is a medium-sized long-tailed, slender and colorful sandgrouse. The species displays prominent sexual dimorphism: the males have a metallic olive-green plumage and the females are browner and barred. Both sexes have a black eye-stripe and a blue eye-ring. Pin-tailed Sandgrouse are loud and gregarious, and can form flocks of hundreds up to thousands outside the breeding season. In summer and autumn, they fly to water sources in the early morning hours to drink and carry water for their chicks.
The Pin-tailed Sandgrouse is resident in the northwestern Negev but nomadic over large areas, concentrating in vegetation patches that appear after rain or agricultural cultivation. Its main distribution area extends between the Re’im-Ofakim line in the north, to the Ezuz-Sde Boker line in the south. Large flocks can be seen in winter, mainly in the area between Urim-Hatserim-Revivim; some of the birds may come from the Syrian or Jordanian deserts. The breeding population is estimated at several hundred nesting pairs.
The Pin-tailed Sandgrouse inhabits loess and sandy plains, broad wadis, low hills, hamada flats and plowed fields. Outside the breeding season, they flock in “green patches” in the desert and in cultivated fields with sparse vegetation. The species prefers steppe or semi-arid areas and is dependent on permanent water sources, and is thus usually seen in areas with annual precipitation exceeding 80 mm. Pin-tailed Sandgrouse nest on the ground in sparse colonies of up to 20 pairs, sometimes together with Spotted Sandgrouse.
Pin-tailed Sandgrouse are affected by development and the increase in the degree of exploitation of sandy and loess areas in the Western Negev. Much of these areas have been converted into grazing and farming, including field crops, citrus groves and greenhouses. Large parts of the area have been afforested with non-native acacia trees, so that they are no longer suitable for ground-nesting birds. Part of the population nests in cultivated areas where birds are vulnerable to farming management, fertilizers and pesticides.
No specific conservation measures have been taken for this species to date.
The Pin-tailed Sandgrouse is classified as an endangered species because of the continued decrease in its populations and the reduction of suitable habitats. It is a nomadic species that wanders over extensive areas and requires permanent water sources for daily drinking. Compared to other sandgrouse species, the Pin-tailed Sandgrouse utilizes agricultural fields for feeding and nesting, which exposes it to an additional array of threat factors. A specific conservation program should be developed for the species, which includes guidelines for supportive management and protection of the species in key natural and agricultural areas.
Sandy and loess areas in the Western Negev, such as the Nitsana-Ezuz area, which are important habitats for Pin-tailed Sandgrouse, should be preserved.
Restoration of afforested areas in the Northern Negev to their natural state.
Control of grazing in the Northern Negev, including restrictions on sheepdogs that endanger ground-nesting birds.
Conducting research to gain a better understanding of the threat factors and the conditions that benefit the population in both natural and cultivated areas.
- פז, ע. 1986. עופות. מתוך אלון, ע. (עורך), החי והצומח של ארץ ישראל. כרך 6. הוצאת משרד הביטחון, ישראל.
- צורים ע, לב ק. ( 2008 ). שינויים בתפוצת הקטות בצפון מערב הנגב בעשורים האחרונים. פוסטר. רשות הטבע . והגנים, מחוז דרום. יום המדע אפריל 2008
- שוחט א, גרניט ב. ( 2010 ). סקר קטות בנגב – קיץ 2010 . דו"ח עבור מחוז דרום של רשות הטבע והגנים.
- שוחט, א. וגרניט, ב. 2011. סיכום סקר קטות באתרי שתיה בניצנה - קיץ 2011. דו"ח רשות הטבע והגנים, החברה להגנת הטבע ומרכז דוכיפת לצפרות ואקולוגיה בירוחם.
- Perlman, Y., Shochat, E. and Labinger, Z. 2011. Developing Managment plan for important bird areas in southern Israel. second annual report, Nizzana region and Arava Valley.Israeli Ornithological center, SPNI.
- Shirihai, H., 1996. The Birds of Israel. Academic Press, London.
- Symes, A. 2013. Species generation lengths. Unpublished, BirdLife International.
- Species page at Birdlife International
Current Occupancy Map
| Data Missing | Sporadic | Limited Sites | Low Density | High Density |
|---|---|---|---|---|
| 0 | 0 | 0 | 0 | 0 |
Distribution maps
The maps presented here provide visual information on the distribution of species in Israel from the past and present, and the changes in occupancy and breeding density during the comparison period. For further reading
Relative Abundance 2010-2020
Breeding density values in the current decade as determined from experts' opinion and observations from databases.
| Data Missing | Sporadic | Limited Sites | Low Density | High Density |
|---|---|---|---|---|
| 8 | 12 | 12 | 21 | 19 |
Relative Abundance 1980-1990
Density values based primarily on the book The Birds of Israel (Shirihai 1996).
| Data Missing | Sporadic | Limited Sites | Low Density | High Density |
|---|---|---|---|---|
| 5 | 14 | 14 | 17 | 22 |
Occupancy 1990-2020
The map shows differences in the species breeding distribution between the 1980's breeding map and the current weighted breeding evaluation. Negative value - species previously bred in the grid and is not presently breeding; positive value - species has not previously bred in the grid and is currently breeding.
| Data Missing | No Change | Occupancy Increase | Occupancy Decrease |
|---|---|---|---|
| 6 | 35 | 1 | 9 |
Change in Relative Abundance 1990-2020
The map shows the changes in the relative abundance of a species in each of the distribution grids between the breeding map of the 1980s and the weighted current breeding evaluation. Negative values - decline in abundance; positive values - increase in abundance; zero - no change in abundance.
| 80 to 100 | 50 | 20 to 30 | No Change | 30- to 20- | 50- | 100- to 80- | Data Missing |
|---|---|---|---|---|---|---|---|
| 0 | 4 | 2 | 22 | 12 | 14 | 11 | 16 |
| Rarity | |
|---|---|
| Vulnerability | |
| Attractiveness | |
| Endemism | |
| Red number | |
| Peripherality | |
| IUCN category | |
| Threat Definition according to the red book |
 Contributed: