Melanocorypha calandra
 Endangered
| Presence In Israel | Summer |
|---|---|
| Breeding In Israel | Breeder |
| Migration Types | Short Range / Partial |
| Zoographical Zones | Mediterranean, Irano-Turanian |
| Landscape Types | Mountainous, Plains & Valleys, Rural Area |
| Vegetation Types | Cropland, Steppe, Herbaceous |
| Vegetation Densities | Low |
| Nest Locations | Ground |
| Diet Types | Herbivore |
| Foraging Grounds | Ground |
| Body Sizes | Small (up to 500g) |
| Threat Factors | Overgrazing, Pesticide Poisoning, Habitat loss and fragmentation, Tree planting |
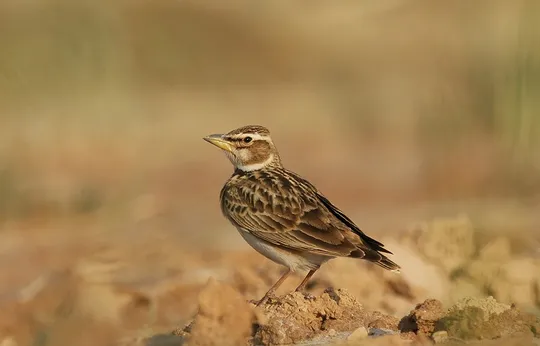
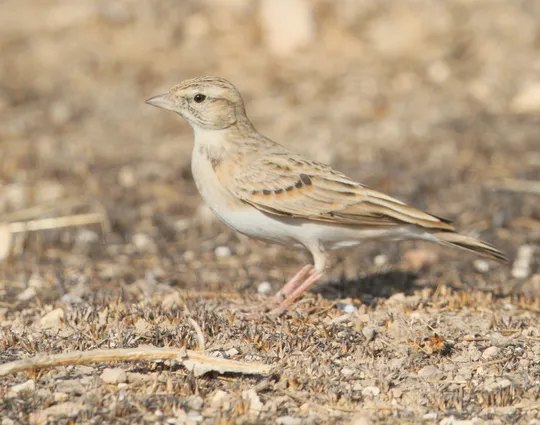
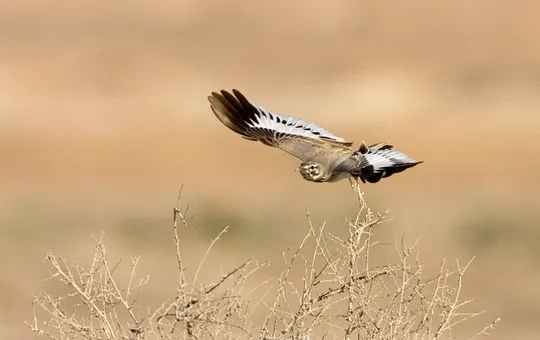
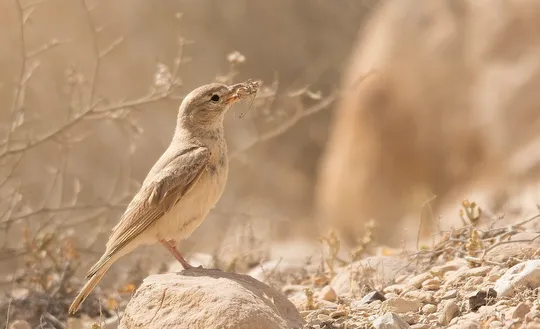
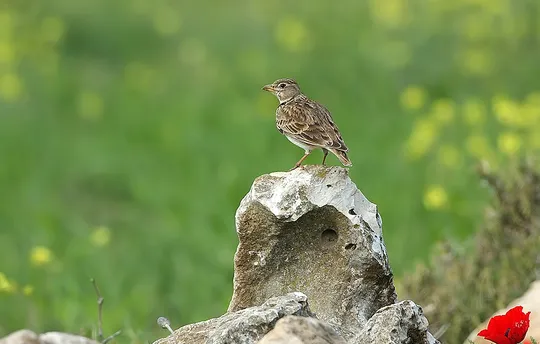
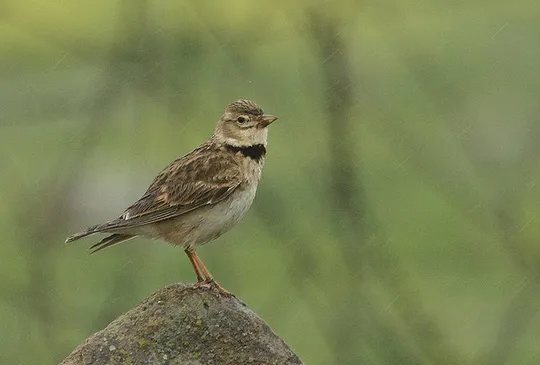
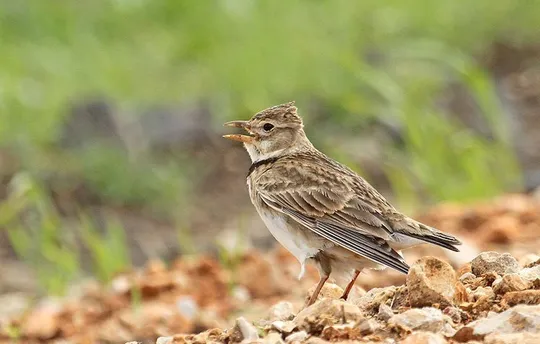
The Calandra Lark is a relatively large lark, larger than the Eurasian Skylark. It has a large strong bill, and a head that appears broad and heavy. On the side of its breast is a prominent black collar. The black underside of the wing is prominent in flight, contrasting with the white trailing edge. The males sing both in flight and on the ground. Their song is loud, trilling and particularly mimicking, and sung early in the morning and in the late afternoon before sunset. It is a relatively rare and declining summer breeder in the Golan Heights, Eastern Galilee, Mt. Gilboa slopes and Eastern Samaria. It is a rare passage migrant throughout the country and in winter can also be seen in the Northern Negev. Until the 1980s, it nested in the Northern Negev down to the Nitsana-Shivta area in the south, as well as in the Judean Lowlands and the Northern Valleys.
Breeds in grassy steppes, grazing pastures and the edges of agricultural fields in plains, valleys and highlands, in Irano-Turanian and arid Mediterranean climates.
The Calandra Lark favors traditionally cultivated agricultural areas of small fields in which no pesticides are used. It has apparently been harmed by agricultural development that includes mechanical cultivation of large monoculture fields, with the use of pesticides. In certain areas, such as the Northern Negev, it has been adversely affected by overgrazing, afforestation and the increase in eruptive species such as Jackals, foxes and Corvids. The main breeding grounds of the species in Israel today are in eastern Samaria and the Golan Heights. In the Golan Heights, it is threatened by extensive development plans.
No specific conservation measures have been taken for this species to date.
The Calandra Lark is classified as Endangered (EN) because of the continued decline in its population size and range. In recent decades it has disappeared from large areas of the Northern Negev, Judean Lowlands and the Northern Valleys. In light of the accelerated development planned for the Golan Heights, key areas of grassy shrubland with dense breeding populations should be located and protected.
Key areas for preservation should be located for the Calandra Lark, such as its breeding sites in the Golan Heights and around the Bet Netofa Valley.
- פז, ע. 1986. עופות. מתוך אלון, ע. (עורך), החי והצומח של ארץ ישראל. כרך 6. הוצאת משרד הביטחון, ישראל.
- Shirihai, H., 1996. The Birds of Israel. Academic Press, London.
- Symes, A. 2013. Species generation lengths. Unpublished, BirdLife International.
- Species page at Birdlife International
Current Occupancy Map
| Data Missing | Sporadic | Limited Sites | Low Density | High Density |
|---|---|---|---|---|
| 0 | 0 | 0 | 0 | 0 |
Distribution maps
The maps presented here provide visual information on the distribution of species in Israel from the past and present, and the changes in occupancy and breeding density during the comparison period. For further reading
Relative Abundance 2010-2020
Breeding density values in the current decade as determined from experts' opinion and observations from databases.
| Data Missing | Sporadic | Limited Sites | Low Density | High Density |
|---|---|---|---|---|
| 8 | 12 | 12 | 21 | 19 |
Relative Abundance 1980-1990
Density values based primarily on the book The Birds of Israel (Shirihai 1996).
| Data Missing | Sporadic | Limited Sites | Low Density | High Density |
|---|---|---|---|---|
| 5 | 14 | 14 | 17 | 22 |
Occupancy 1990-2020
The map shows differences in the species breeding distribution between the 1980's breeding map and the current weighted breeding evaluation. Negative value - species previously bred in the grid and is not presently breeding; positive value - species has not previously bred in the grid and is currently breeding.
| Data Missing | No Change | Occupancy Increase | Occupancy Decrease |
|---|---|---|---|
| 6 | 35 | 1 | 9 |
Change in Relative Abundance 1990-2020
The map shows the changes in the relative abundance of a species in each of the distribution grids between the breeding map of the 1980s and the weighted current breeding evaluation. Negative values - decline in abundance; positive values - increase in abundance; zero - no change in abundance.
| 80 to 100 | 50 | 20 to 30 | No Change | 30- to 20- | 50- | 100- to 80- | Data Missing |
|---|---|---|---|---|---|---|---|
| 0 | 4 | 2 | 22 | 12 | 14 | 11 | 16 |
| Rarity | |
|---|---|
| Vulnerability | |
| Attractiveness | |
| Endemism | |
| Red number | |
| Peripherality | |
| IUCN category | |
| Threat Definition according to the red book |
 Contributed: